
4. What Is Wrong with Shanghai? - Capitalism with Chinese Characteristics: Entrepreneurship and the State
By Yasheng Huang
Chapter 4: What Is Wrong with Shanghai?
Why can't India plan bullet trains when China can smoothly roll hi-speed trains between Shanghai and Pudong covering a stretch of over 450 km in one hour?
– Jayant Patil, finance minister of the Indian state of Maharashtra
We must acknowledge that relative to the needs of economic growth and social development, Shanghai is not dynamic enough. The praise for Shanghai's dynamism mainly comes from the mouths of international friends based on impressionistic comparisons with metropolises of foreign countries.
– A report by the Shanghai Association of Industry and Commerce (2006, p. 29)
Nowhere else in the world has Shanghai inspired more imagination – and despair – than in the Indian city of Mumbai (particularly during its monsoon season). Indian intellectuals and business people ask, often in great exasperation, “Why cannot Mumbai be more like Shanghai?” Prime Minister Manmohan Singh, an Oxford-trained economist and a man steeped in humanistic values, nevertheless sees the heavy-handed Shanghai as a model. This is an excerpt from a speech he gave in March 20061:
When I spoke of turning Mumbai into a Shanghai, many wondered what I had in mind. It is not my intention to draw a road map for Mumbai's future. But I do believe that Mumbai can learn from Shanghai's experience in reinventing itself; in rebuilding itself; in rediscovering itself.
This chapter begins with a quote by Jayant Patil, the finance minister of the Indian state of Maharashtra. His observation of Shanghai is fascinating. It shows the depth of admiration Indians have for Shanghai as an economic model. His comment, however, also shows that he knew next to nothing about the city he so admired. The high-speed train, known as Maglev, referred to by Patil, travels not from Shanghai to Pudong but rather between two locations within Pudong. It does not cover 450 km but rather only 30 km and it completes its journey 52 minutes ahead of Patil's schedule – in less than 8 minutes. Patil is Exhibit A of the deeply flawed infatuations foreigners have about Shanghai, as pointed out by the report prepared by the Shanghai Association of Industry and Commerce (quoted at the beginning of this chapter).
The story of Shanghai is one of two extremes. At one extreme, Shanghai is viewed as a model of economic development and as a symbol of a rising and prosperous China, as the quotes from the Indian politicians show. At the other extreme, there is virtually no real knowledge about this city. It is unlikely that Prime Minister Singh has any detailed information about how Shanghai actually generates economic growth and creates wealth. He simply presumes the existence of these mechanisms firmly in place in Shanghai.
Much of the admiration for Shanghai is based on visual evidence. Just look at Shanghai's impressive and imposing skyline and the conclusion is obvious. Simon Long of The Economist opined that India has been “lapped” in its race with China. Why? For Long (2005), the proof is in the contrast between his experiences traveling in Shanghai and Mumbai. Returning to Shanghai was “a bewildering experience” as “[o]ccasionally, through the new skyscrapers, a familiar building appears, lost in the concrete jungle.” Returning to Mumbai was infinitely more assuring. There was no new airport and the only innovation was an improved queuing system in the immigration hall. Long thus concludes, “Whereas its neighbor has been transformed out of all recognition, India has, in most visible essentials, stayed the same.”
It might seem preposterous even to ask the question, “What is wrong with Shanghai?” Yet, this is precisely what this chapter is going to do and to argue that plenty is wrong with Shanghai. Much of the hype about Shanghai is heavily based on impressions (and on GDP data). The “Shanghai miracle” is assumed but not demonstrated. The “tyranny of numbers,” in the words of Alwyn Young (1995), has led me to question the very foundation of this miracle. As in the rest of this book, I rely heavily on micro data for analysis. Three sources of data have been especially important in uncovering the economic dynamics of Shanghai: the well-designed rural and urban household surveys by the NBS; the series of private-sector surveys on larger and more established private enterprises; and a comprehensive, professionally managed patent database. Apart from the fact that these data get at the important microeconomic dimensions of Shanghai, they have another distinct advantage over GDP and FDI data: GDP and FDI data are explicit benchmarks used by the Chinese political system to promote or demote officials. The likelihood that the Micro data I report are politically tainted is much less and they thus reflect more accurately the economic dynamics on the ground.
Let me summarize the main findings based on detailed analyses of these data sources. First, although it is true that Shanghai has had excellent GDP performance, much of this performance seems to have only moderately improved the living standards of the average Shanghainese. A huge portion of Shanghai's GDP accrues not to Shanghai's households as personal income but rather to the government in the form of taxes and to corporations in the form of profits. Corporations in Shanghai are either heavily controlled by the government or their control rights are shared with foreign companies. The exalted GDP numbers translate into only modest levels of household income in Shanghai. Relative to the country as a whole, Shanghai's households are not nearly as rich as the city's GDP level suggests.
Second, in the 1990s, Shanghai's GDP growth was not pro-poor and since the late 1990s, its growth has been sharply anti-poor. The poorest segments of the Shanghai population have lost absolutely – relative to their income position in the past – since 2000. As recently as 2005, rural Shanghainese, who still accounted for a sizable share of the workforce,2 had about the same income level as they did in 1989 relative to the rural income level of the country as a whole. The income position of urban Shanghainese, compared to the urban income of China as a whole, improved only marginally since the early 1990s. Whereas Shanghai households enjoy the highest wage level in the country, they earn very little money from their asset ownership, not just compared with households living in rich provinces but also compared with households living in some of China's poorest provinces. The huge construction and real estate booms that outside analysts associate with Shanghai appear to have done very little to benefit the average Shanghai households. Their rental income is among the lowest in the country. Third, despite its reputation of being a high-tech hub of China, there is no hard evidence that Shanghai is innovative. Measured in terms of patent grants per year, Shanghai consistently under-performed two of China's most entrepreneurial provinces, Zhejiang and Guangdong.
These little-known facts about Shanghai raise the question whether there is a Shanghai miracle at all. Our chapter begins with this question. Throughout the chapter, I benchmark Shanghai against Zhejiang and Guangdong (as well as some other provinces) for a very specific reason: Despite a rich history of business creation and risk-taking, entrepreneurship is almost completely missing in Shanghai today. This is the subject of the second section of this chapter. The “missing-entrepreneurship” phenomenon is extreme. In terms of small-scale household businesses, Shanghai ranks at the bottom of the country. In terms of larger, established private-sector businesses, Shanghai is under-developed relative to some of China's poorest agricultural provinces.
There is no good economic rationale why this is the case. Shanghai's lack of entrepreneurial development is entirely the result of its policy choices. The Shanghai model can be characterized as having three key elements. The first is heavy-handed intervention by the state in most micro affairs of the economy. The second is that the city has the most blatant anti-rural bias in its policy orientation in the country. (And, according to the line of reasoning developed in this book, an anti-rural policy orientation is strongly anti-market.) The third is a biased liberalization that privileges foreign capitalists – namely, FDI – and restricts and discriminates against indigenous capitalism. The chapter concludes with some broad conjectures about the true reasons behind the Shanghai miracle – that the city, taking advantage of its privileged political position, was heavily subsidized by the rest of the country.
1 Is There a Shanghai Miracle?
It is not an exaggeration to say that Shanghai is the most admired city in China in the eyes of foreign observers. Thomas Friedman, the influential New York Times columnist and an occasional Shanghai visitor, is a fan. The playing field has been leveled between “Shanghai and Silicon Valley,” he stated. This is his description of Shanghai: “You can work where you want, live where you want, wear what you want, study abroad if you want, get from the Internet most of what you want and start a business if you want.”3 Academics are equally enthusiastic. Doug Guthrie (1999), a NYU professor who did all his field research in Shanghai for his book, Dragon in a Three-Piece Suit, described Shanghai as “the head of the dragon.” Shanghai is the vanguard of the market reforms in China and, as Guthrie put it, it is one of “the most legalistic and institutionalized areas.” No empirical evidence was actually produced to demonstrate that Shanghai was the vanguard of the economic reforms. The fact is so obvious that one has only to assert it.
Yusuf and Nabeshima (2006), two economists at the World Bank, provide more data about Shanghai in their book, Postindustrial East Asian Cities, but much of their data are really the statistical equivalent of tourist impressions. These include the fact that Shanghai constructed more than 3,000 buildings taller than 18 stories since the mid-1990s, it has a Maglev express train – the most advanced in the world – it has restored its historic buildings to their original grandeur on a massive scale, and it revitalized the cultural life of the city. The World Bank as an institution has long been enamored with Shanghai. In 2004, the Bank convened a large international conference on poverty in a posh Pudong hotel. The delegates to the conference had a chance to personally observe what China was supposed to have accomplished. One of the main themes emerging from the conference was that China succeeded in reducing poverty precisely because it did not protect its peasantry. Rapid urbanization was the only way out of poverty, the Bank pronounced at the end of the conference.
The World Bank has been intellectually consistent about Shanghai. China – and Shanghai in particular – has been the Bank's best student and its most admired teacher in FDI liberalization and globalization. Shanghai has indeed moved quite far on the path of globalization. The annual flow of FDI now amounts to 6.5 billion dollars, equivalent to the entire FDI inflow of India today. Not only does Shanghai attract a lot of FDI, it is able to attract the cream of the FDI – investments made by large and technologically sophisticated multinational corporations (MNCs). Just after China joined the WTO, some 300 global MNCs had already made investments in Shanghai, and 30 percent of them were contemplating making Shanghai their regional headquarters. The companies that have invested in Shanghai read like a who's-who list of the most prominent MNCs in the world, such as Delphi, GE, Mitsubishi, Itochu, Siemens, Hitachi, and Carrefour. Although Shanghai accounted for 5.5 percent of China's GDP in 2004, its share of exports was more than double its GDP share, around 12 percent. In 2004, FIEs accounted for 63.2 percent of Shanghai's gross industrial output and 67.3 percent of its total exports.
This would be the end of the conventional analysis of Shanghai. The excellent GDP performance and the massive FDI inflows must have improved the welfare of the average Shanghai residents enormously. The inference is so obvious that it obviates a need to actually examine whether this is true in reality. In this section, we take Shanghai's GDP performance as the start of our analysis and explore the answer to the question, “Has Shanghai's GDP performance improved the welfare of the average Shanghainese?”
1.1 Welfare and GDP
Shanghai has some exalted GDP numbers. For example, in 2004, Shanghai's GDP per capita was 55,037 yuan (about US$6,880). This was 5.2 times China's GDP per capita. By this measure, Shanghai unquestionably deserves the title as the head of the dragon. GDP data, however, are extraordinarily tricky.4 GDP per capita is often loosely referred to as income per capita. That phrase leaves the impression that an average Shanghai resident earns an income close to its GDP per capita (i.e., 55,037 yuan). Many foreign firms, for example, use GDP per capita data to design sales strategies in their regional marketing plans, but this assumption is deeply flawed.
There are two ways to disaggregate GDP data. One is the expenditure approach, under which GDP is disaggregated into consumption, investment, government spending, and net exports. The expenditure approach is the most common method by which GDP data are reported for China and for other countries. The alternative approach is the income approach, under which GDP is divided into the following components: (1) labor income (i.e., wages and benefits), (2) capital income (i.e., business profits, interest, and rent), (3) depreciation, and (4) taxes (i.e., income to the government). Depreciation is otherwise known as consumption of fixed capital and it refers to the amount that businesses set aside to replace worn-out structures and equipment. Calculations of the income components of GDP often require removing the depreciation amount from GDP. GDP minus depreciation becomes the net national product.
The other three components of GDP represent income accruals to the three main players in an economy: labor, capital owners, and government. This decomposition of GDP immediately illustrates the fallacy of the common assumption: That GDP per capita was 55,037 yuan in 2004 does not at all mean that an average Shanghainese earned 55,037 yuan. The 55,037 yuan was shared among labor, capital owners, and government. Importantly, it matters how the GDP is distributed among them.
Panel (1) of Figure 4.1 presents the percentage shares of the three components of what is known as the net regional product for Shanghai and Zhejiang in 2002. (The year 2002, the last year of Jiang Zemin's rule, marked the apex of the urban bias model.)
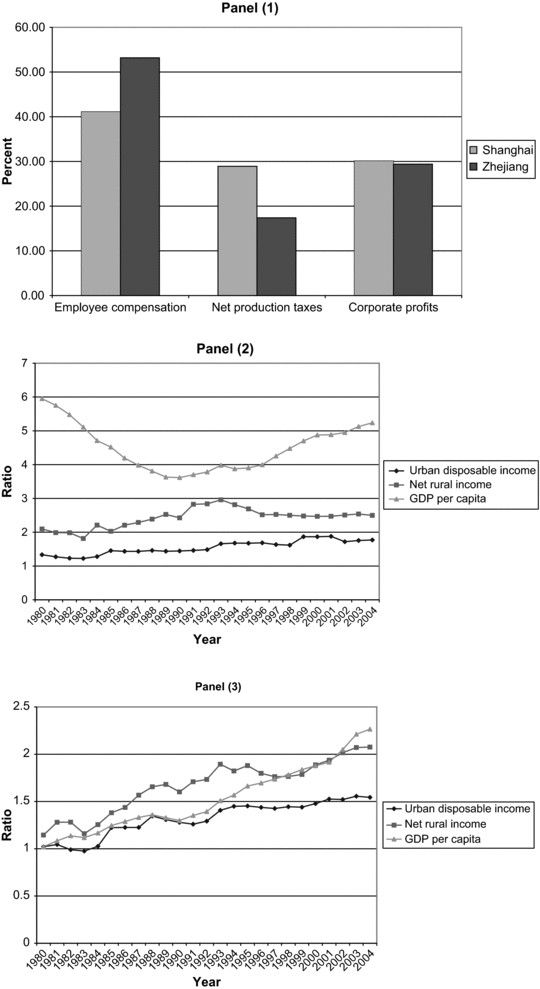
Figure 4.1. Benchmarking Shanghai: Various indicators. Panel (1): Components of net regional product in Shanghai and Zhejiang (based on income approach of GDP), 2002 (%). Panel (2): Ratios of Shanghai to national averages: Urban disposable per capita income, rural per capita net income and GDP per capita, 1980–2004. Panel (3): Ratios of Zhejiang to national averages: Urban disposable per capita income, rural per capita net income and GDP per capita, 1980–2004. Sources: The GDP data by income approach are from NBS (2004a, p. 64). Other data are drawn from China Statistical Yearbook, various years and rural and urban household surveys by NBS, various years.
The Chinese data on employee compensation include both wages and benefits as well as proprietors’ income. In 2002, employee compensation comprised 41 percent of Shanghai's net regional product. This is a remarkably low ratio. In the United States, the labor income and proprietors’ income together typically exceed 70 percent of the net national product.5 Shanghai's ratio is also low compared with Zhejiang. This comparison is both to minimize any differences in statistical reporting and other discrepancies as well as to illustrate a difference in the income accruals between Shanghai and the entrepreneurial economy of Zhejiang. An entrepreneurial economy has a high share of employee compensation (inclusive of proprietors’ income), whereas a statist economy has a low share.
Employee compensation comprised 53 percent of the net regional product in Zhejiang, a full 12 percent higher than in Shanghai. The two provinces have almost identical shares of corporate profits, about 30 percent, which implies that the key difference between the two is the income accruing to the government. For Shanghai, the ratio is 28.9 percent; for Zhejiang, the ratio is 17.4 percent. The upshot of this analysis is that an average resident in Zhejiang captures 10 percent more of each increment in economic output than does her counterpart in Shanghai. She is 10 percent richer but her government is 10 percent poorer.
In fact, the difference is probably several multiples of a 10 percent differential in the employee compensation share. This is because Shanghai is significantly more state-owned than Zhejiang. Corporate profits in both regions account for about 30 percent of the net national product, but there is a difference in the ownership of corporations. Many capital owners in Zhejiang are private, whereas in Shanghai they are government agencies. We have fairly detailed ownership composition data on industry and we can assume that the ownership composition for the entire economy is similar to that for industry.
In 2002, SOE and government-controlled firms in Shanghai accounted for 39.4 percent of the industrial output value, compared with only 13.6 percent in Zhejiang (NBS 2003b, p. 461). Extrapolating from these output shares would lead to the conclusion that the private income share of GDP is 52.7 percent in Shanghai and 69.3 percent in Zhejiang. To be precise, in fact, we need to make another adjustment. Foreign firms accounted for a far higher share of industry in Shanghai than they did in Zhejiang. The difference may have been as high as 30 percent. To get at the income share accruing to indigenous residents, we would have to deduct the foreign share of economic output. However, this is a difficult exercise because of the overlapping ways in which the Chinese report the data.6
Shanghai is rich but an average Shanghainese is not. A huge share of the economic gains go to the government and the state-controlled businesses. Recall that Shanghai's GDP per capita is 5.2 times the national GDP per capita. But urban household surveys show Shanghai residents to be considerably poorer than this GDP ratio implies. In 2004, the urban disposable income per capita in Shanghai was 16,683 yuan (just above 2,000 dollars); for the country as a whole, the figure was 9,421.6 yuan. This implies a Shanghai/China ratio of 1.77, nowhere near the 5.2 ratio calculated on the basis of per capita GDP data. On the basis of per capita GDP for urban areas only, the ratio between Shanghai and Zhejiang was 1.92 in 2004, suggesting that Shanghai was almost twice as rich as Zhejiang. The Shanghai/Zhejiang ratio will be reduced to only 1.14 if we use the urban disposable income data. By this measure, Shanghai was only 14 percent richer than the urban regions of Zhejiang.
Let us examine this discrepancy between GDP data and income data from the household surveys. The household surveys were conducted on typical households living in Shanghai; thus, they reflect the economic well-being of the average Shanghainese. That the two data series have a huge gap between them suggests that there is a disconnect between the ostensibly impressive GDP performance of the city and the economic well-being of the population (numbering around 13 million). Specifically, we ask the following question, “Given that Shanghai has a very high level of per capita GDP, how have average Shanghainese fared relative to the rest of the country?” To get at this issue, I calculated the ratios of Shanghai's GDP, urban disposable income, and rural net income – all on the basis of per capita data – to their national averages. The results are presented in Panel (2) of Figure 4.1.
The line at the top, representing the ratios of per capita GDP, is shaped like a V. Shanghai began in 1980 at a very high per capita GDP relative to the rest of the country, but that ratio declined steadily until 1990 when it began to rise rapidly. In 1980, the per capita GDP ratio was around 5.9; in 2004, the ratio was 5.24. Thus, during the 24 years between 1980 and 2004, Shanghai seemingly went through a full cycle: In the 1980s, the city lost relative to the rest of the country, but in the 1990s, it regained its previous dominant position. This would be the conventional-wisdom interpretation of the economic history of Shanghai based on the GDP data.
Let us look at the other two lines in the graph representing the rural net income per capita and the urban disposable income per capita, respectively. The indicators based on the household-income surveys, a more accurate measure of the economic well-being of the average Shanghainese than the GDP data, would cast doubt on this interpretation. The line in the middle, which represents rural net income, is shaped like an inverted V or a pyramid, almost a flipped image of the GDP per capita ratio. After an initial decline between 1980 and 1983, the ratio steadily rose, peaking in 1993, and then it declined or stayed flat for the rest of the period. At its peak, the ratio was 2.96 in 1993. In 2004, it was 2.5, exactly the same ratio as in 1989. An apt description of the line representing the urban disposable income ratio is a staircase with elongated but low stairs: The ratio rose by very small steps with many flat years in between. The ratio rose in 1985 to 1.46 (from 1.28 in 1984) and stayed flat until 1993, when it rose from 1.49 to 1.66. It then remained flat for another six years and rose only in 1999 to 1.87 and then resumed the flattening pattern until 2002, when the ratio declined to 1.72.
What do these numbers mean? The first striking pattern is a systematic inverse relationship between the GDP measure and the income measure. In the 1980s, when Shanghai's GDP per capita declined against the rest of the country, the income of its average residents was actually gaining, and this was especially true for its rural residents. In the 1990s, the relationship between per capita GDP and per capita rural income was still negative, but the movements of these two variables reversed their directions. Shanghai's per capita GDP grew substantially faster than the rest of the country beginning in 1990. (Again, the change came during the Tiananmen interlude.) In 1990, the ratio was 3.62. It was 3.98 in 1993, 4.25 in 1997, 4.88 in 2000, and 5.24 in 2004. At 5.24, Shanghai was roughly where it was in 1983 (5.11) in terms of its position vis-à-vis the rest of the country.
Many hail Shanghai's GDP development as evidence of its boom and miracle – many, that is to say, except those people living in Shanghai. After peaking in 1993, rural Shanghainese steadily lost ground relative to rural Chinese elsewhere in the country. Rural Shanghainese were still the richest in the country but, in 2004, their margins relative to the rest of the country had decreased. In 1993, the ratio was 2.96; in 2004, it was 2.49. This is exactly where Shanghai was in 1989. Urban Shanghainese fared only slightly better. They managed to increase their income margins relative to the rest of urban China but at an extraordinarily modest pace. Their margins rose every seven years or so, in 1985 (1.45), in 1993 (1.66), and then in 1999 (1.87). In 2004, the ratio was 1.77, a decline from the 1999 level.
Let me more formally demonstrate the negative relationship between Shanghai's GDP and its income levels – both relative to the rest of the country. A measure of simple two-way relationships between two variables is a Pearson correlation coefficient. When the coefficient is negative, the two variables are negatively correlated with each other; otherwise, they are positively correlated with each other. The Pearson correlation coefficient for Shanghai's GDP per capita and urban income per capita is −0.12; the Pearson coefficient for Shanghai's GDP per capita and rural income per capita is −0.62. In other words, there is a systematic negative relationship between Shanghai's GDP and the income levels of its population, although the strength of the relationship is much greater for the rural data than it is for the urban data.
The next question is why Shanghai exhibits such a pattern. One hypothesis is that a state-controlled economy can grow without improving the economic well-being of its average residents. For example, government-controlled corporations can invest heavily and reap huge gains through profit distributions. The government can finance heavy investments through taxes that reduce the income share of households. In contrast, an entrepreneurially driven economy can grow only by improving the personal incomes of the average households. We have already demonstrated that in entrepreneurial Zhejiang, the employee compensation share of GDP is much higher than it is in Shanghai. A logical inference is that GDP performance in Zhejiang is positively correlated with the household income of the average Zhejiang residents. This is confirmed in Panel (3) of Figure 4.1, which graphs the ratios of Zhejiang's per capita GDP, urban household income, and rural household income relative to the values of the national averages. In sharp contrast to the pattern visible on the Shanghai graph, the three lines move closely together. The Pearson correlation coefficient for the GDP per capita and urban household income is 0.91; it is 0.90 for the GDP per capita and rural household income data series. The welfare implications of the state-centered, interventionist Shanghai model and of the entrepreneurial Zhejiang model cannot be more clear.
1.2 Is Shanghai Poor?
In 2004, the World Bank convened a large-scale conference in Shanghai on global poverty. David Dollar, who wrote extensively about the supposed connections between globalization and poverty reduction in China, explained why the conference was held in Shanghai, “The World Bank looks around the world for successful stories, interprets it and then proselytises the interpretation – and that is often pretty good.”7
Shanghai, according to the Financial Times article covering the event, is “a fitting location.” It is one of the best students of globalization. In the 1990s and since China joined the WTO, the city has received a massive amount of FDI. In Chapter 1, I have already shown that much of China's poverty reduction occurred in the 1980s when the country was minimally globalized. In the 1990s, not only did the pace of poverty reduction slow down dramatically, but also there were significant setbacks. (In the concluding chapter of this book, I return to this issue and note that China in the 1990s revised downward its poverty threshold several times so more people were lifted above poverty – in a statistical sense.) In this section, let's examine how poor people were faring in Shanghai, right under the noses of the World Bank delegates.
Figure 4.2 presents the real annual growth of urban household income averaged over three periods, 1986–1988, 1989–2003, and 2001–2003. The data were taken from the website of the Shanghai government and are based on the annual urban household surveys conducted by the NBS. The figure presents the real income growth rates. The nominal incomes were deflated to their 1978 prices (based on Shanghai consumer price indices). The Shanghai website breaks down income levels by seven groups: (1) lowest, (2) second lowest, (3) lower-middle, (4) middle, (5) upper-middle, (6) high, and (7) highest. These seven income groups are arrayed from left to right in the figure. I divided the data into three periods in order to detect any differences in the income-growth dynamics.
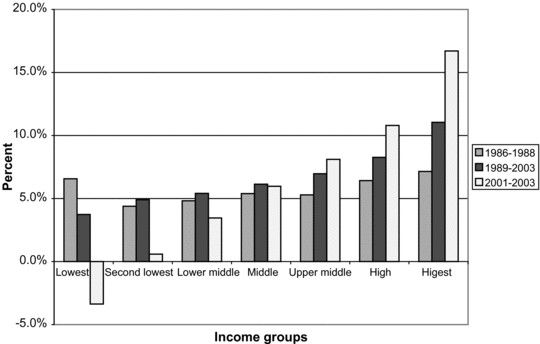
Figure 4.2. Real per capita urban income growth across three income groups in Shanghai: (1) 1986–1988, (2) 1989–2003, and (3) 2001–2003 (%). Note: The deflators used are Shanghai consumer price indices (1978=100). Source: The data are from the website of the Shanghai government. See http://www.stats-sh.gov.cn/2004shtj/tjnj/tjnj2006.htm#, accessed on July 13, 2007.
The pattern is very interesting. During the 1986–1988 period, the growth rates across the seven income groups are fairly even. The highest income group grew at the fastest rate (7.15 percent), but the second highest rate was registered by the lowest income group, at 6.57 percent. The other four income groups grew within a fairly narrow band. The dynamics during the 1989–2003 period is entirely different. This time there is an unmistakable pattern: The higher the income level, the higher its growth rate. And the differentials at which income grew between the income groups became very large. The lowest income group registered a growth rate of 3.73 percent, whereas the highest income group registered a growth rate at 11.05 percent. This is more than a threefold difference.
During the 2001–2003 period, the anti-poor bias of Shanghai became blatant. The lowest-income group lost 3.4 percent of their income and the second-lowest income group made no gains (0.6 percent). The growth rates of the next two income groups – lower middle and middle – slowed down considerably, both against the 1980s as well as against the rest of the 1990s. The upper-middle, high, and highest income groups gained enormously during this period. The highest income group grew at 16.7 percent annually, exceeding its already supersonic rate of 11 percent by almost 7 percent.
Two notes about the data. First, the household surveys do not include unregistered migrants and thus we could have an upward bias in the income data given that the unregistered migrants have historically been poorly treated by their employers and often go on for months without pay. Second, starting in 2004, the Shanghai government stopped reporting income figures for the lowest and second lowest income groups and the high and highest income groups separately. The seven income groups in the previous years are now consolidated into five income groups, which makes a detailed analysis difficult.
The difference in the growth rates between the highest income group and the lowest income group in Shanghai is 20 percent (16.7 percent minus −3.7 percent). All of these developments occurred right on the eve of the World Bank's conference on global poverty in Shanghai. Shanghai is a fitting location for a poverty conference but the rationale is diametrically opposite from the World Bank's “proselytisation.” Shanghai's top-down model and state-led urbanization programs are inherently anti-poor.
1.3 Is Shanghai Rich?
Shanghai's Xintiandi – New Heaven and Earth – exhumes the wealth and affluence. It is located in a district, most ironically, where the first congress of the Chinese Communist Party was convened in 1921. Today, it houses avant-garde fashion boutiques, expensive bistros, and art galleries. Its architect, Benjamin Wood, who revitalized Boston's Faneuil Hall, applied the same formula to Xintiandi – in his words, he wanted to give Shanghai “a great European-style public space where people could go enjoy themselves.”8 With such a visible symbol of affluence, it is tempting to draw the conclusion that Shanghai is the consumption capital of China. Indeed, many MNCs use Shanghai to illustrate their strategy of targeting China's emerging consuming middle class. McKinsey, for example, foresees the rise of an urban middle class in China by 2025, with a spending power of some $2.4 trillion, equivalent to what Japanese households spend today. Shanghai features heavily in this type of analysis.
Elites in Shanghai are wealthy. This is not in doubt. The issue here is whether the level of wealth of the average Shanghai residents compares with the level of wealth elsewhere in China. To examine this question, we go to the NBS urban household surveys.9 The NBS surveys collect information on incomes derived from owning property. The sources of property income are comprised of interest and dividend payouts or income from property rentals. All else being equal, there are some very good reasons why households in Shanghai should do very well on this score. For one thing, the rental income ought to be high because Shanghai experienced a real estate boom in the 1990s. But, it turns out that Shanghai is remarkably poor in asset terms.
In 2004, Shanghai's per capita property income was 215 yuan (about US$26) and in 2002 it was only 94.4 yuan (US$11). These are fractions of what urban residents in Zhejiang and Guangdong earned from property income. In fact, Shanghai urban households are not only asset poor compared with Zhejiang and Guangdong, they are also asset poor compared with the rest of urban China. Relative to all of urban China, the per capita property income of Shanghai households was between 0.6 (in 1996 and 1999) and 0.8 (in 2002) of the national average. In 2004, there was a sharp increase in the ratio of Shanghai to the rest of urban China, to about 1.3. The rise was mainly driven by the growth in rental income between 2002 and 2004. Even at 1.3, Shanghai is not particularly wealthy. Keep in mind that Shanghai's GDP per capita is 5.2 times the national average.
The low level of Shanghai's property income warrants further exploration. As low as the property income was in Shanghai in 2002 and 2004, this was already a substantial improvement over earlier years. Shanghai began to turn around in 2002, as indicated by the huge improvement from 94.4 yuan in 2002 to 215 yuan in 2004. In 2001, the per capita property income was only 39 yuan (US$5) and, in that year, Shanghai was ranked 25th out of 31 provinces in terms of the level of its property income. A Shanghai resident was worse off compared with residents in some of China's poorest provinces, such as Gansu (42 yuan), Shaanxi (53.8 yuan), and Ningxia (40.4 yuan).
An even more remarkable development is that between 1992 and 2001, an average Shanghai resident, in fact, experienced a decline in property income. This is not a decline in relative terms – relative to other sources of income. The property income declined in absolute terms; an average Shanghai resident was worse off in 2001 than she was in 1992 as measured by her property income. In 1992, the average property income was 44 yuan, compared with 39 yuan in 2001. All of this took place when GDP in Shanghai was growing at a double-digit annual rate. (These are all nominal values before inflation is taken into account.) In 1992, only four other provinces generated a higher level of property income than Shanghai (Zhejiang, Fujian, Guangdong, and Hainan). That Shanghai slipped from number five in the country in 1992 to number 6 from the bottom in 2001 is truly dramatic. Many observers believe that Shanghai experienced a Renaissance in the 1990s. The truth is that for Shanghai's average households, the massive growth brought about very little in wealth creation.
A comparison with entrepreneurial Zhejiang is revealing. In 1992, urban residents of Zhejiang, on average, earned property income that was 1.58 times that of a typical Shanghai resident. By 2001, this Zhejiang advantage had grown to 4.3 times. We can rule out a potential confounding factor – that Shanghai residents may consume a lot and, therefore, earn very little in the way of interest income. The huge difference between Shanghai and Zhejiang is due to the two components of property income – dividend income and rental income. The average dividend income in Zhejiang in 1996 was 27.65 yuan, 4.3 times that in Shanghai (6.43 yuan). The differential in the rental income was even larger. In Zhejiang, it was 22.54 yuan but in Shanghai, it was only 0.37 yuan – US$0.045 – a differential of 60.9 times. In fact, in 1996, the only reason why Shanghai avoided being dead last in the country was that rental income in Tibet was zero in that year.
The incomes from interest and dividend payouts represent the incomes derived from the savings set aside by households in previous years. That Shanghai's property income is so low indicates that there is a very low savings rate. Based on the income approach of GDP, we can know how much income was earned by households in a given year, and from the expenditure approach of GDP we can also know how much households spend in a given year. The difference between the two is the household savings. By this calculation, in 2002, the household savings rate in Shanghai was only 1.29 percent.10 This compares with 13.7 percent in Zhejiang. There are many complications involved in calculating an accurate household savings rate, including the fact that the income approach of GDP does not include transfer payments, which can also be saved. The point of this exercise is not to argue that Shanghai's household savings rate is actually only 1.29 percent. The point is that the same estimation shows that Zhejiang has a significantly higher savings rate than Shanghai.
1.4 Jobless Growth
One of the most perplexing developments in the 1990s was that employment failed to grow. Employment growth in the 1990s in China as a whole did not remotely match employment growth in the 1980s, and several studies show that for the country as a whole, employment elasticity with respect to growth fell substantially in the 1990s.11 This growth in joblessness took an extreme form in Shanghai. In the 1990s, not only did employment grow at a slower rate than GDP, the size of employment actually contracted.
Chinese statistical sources provide data on two employment measures.12 One is the narrower measure covering staff and workers in formal establishments, mainly in the urban areas. This measure excludes employment in private-sector firms and self-employed businesses but does include employment in SOEs, collective firms, and FIEs. The second is a broader measure that includes both staff and workers in formal establishments as well as workers located in rural areas who receive remunerations. Workers in TVEs are included in the second measure but not in the first. We call the broad measure aggregate employment and we call the narrow measure urban employment.
Both measures show a sharp reduction in employment in Shanghai in the 1990s, especially in the second half of the 1990s. In 1995, aggregate employment stood at 7.9 million; by 2000, it was 6.7 million, a reduction of 15 percent. Since 2000, however, there has been a recovery in the creation of employment. Only in 2004 did aggregate employment in Shanghai recover to its 1995 level (8.1 million). That Shanghai had about the same level of employment in 2004 that it had 10 years earlier is quite remarkable. During those 10 years, Shanghai experienced an unprecedented boom in real estate; FDI; and industrial, commercial, and cultural activities. Its GDP expanded several-fold, and there were massive infrastructural investments. It is also remarkable in comparison with other regions that also experienced rapid economic growth but were also able to create jobs. The aggregate employment in Zhejiang expanded from 26.2 million in 1995 to 32 million in 2004. In Guangdong, it grew from 35.5 million to 47 million during the same period. Guangdong and Zhejiang were able to generate GDP growth and to create something in scarce supply in a populous country such as China – a job.
The narrower measure of employment – urban employment in the state, collective, and foreign sectors – shows an even sharper reduction.13 And this reduction began to occur earlier than that in the aggregate measure of employment. In 1990, the number of staff and workers in Shanghai stood at 5.08 million; this number shrank by almost 50 percent in 2004, to 2.64 million. Although aggregate employment expanded modestly between 1990 and 1995, urban employment began to decrease even in the first half of the 1990s. In 1995, urban employment was 4.7 million. Again, the contrast with the more entrepreneurial provinces is substantial. Between 1990 and 2004, urban employment in Guangdong expanded from 7.86 million to 8.12 million. Zhejiang, however, experienced a decline in urban employment but not nearly as severe as that in Shanghai. Urban employment contracted by 8.7 percent between 1990 and 2004 (compared with 50 percent in Shanghai).
The rather poor job picture in Shanghai in the 1990s may help explain the shrinkage of property income of the average Shanghai resident as shown in the NBS urban household survey data. One possibility is that many Shanghai residents might have had to draw on their savings to support themselves. This would be due to a combination of the rising unemployment and the fact that single-proprietor income failed to rise. This hypothesis is consistent with something else I reported earlier – Shanghai's household savings rate is very low. The sharper reduction in urban employment as compared with aggregate employment raises another issue. Because Shanghai had a large state sector, a substantial component of the urban employment consisted of workers in SOEs. Thus, one could argue that the sharp contraction in urban employment was due to restructuring – the shedding of the excessive workforce in the SOEs. The sharp reduction in employment, although wrenching both politically and socially, can be viewed as a sign of a determined effort to reform the city.
Shanghai seems to have pursued one of the most aggressive restructuring programs in the country. In fact, the degree of the restructuring appears to have gone deeper and wider even compared with that in entrepreneurial Guangdong and Zhejiang. In 2004, urban employment in Shanghai's state sector was only 32 percent of what it was in 1990. In comparison, the SOE restructuring in Guangdong and Zhejiang was far less aggressive. In 2004, state-sector employment in Guangdong was 68.8 percent of its 1990 level; in Zhejiang, it was 60.6 percent.
This combination of a seemingly aggressive restructuring program aimed at SOEs and slower growth of the private sector casts doubt on a number of conventional explanations about the reforms in China. One popular explanation is that the Chinese government hesitated to privatize the SOEs because of the substantial negative social implications. Unemployment can lead to social unrest and thus even the inefficient SOEs had to be kept alive. But Shanghai does not seem to have been fazed by the social implications of the restructuring program. One would have expected Shanghai to have been extra cautious. After all, this is a city that has a high visibility abroad and any instances of social unrest would have a greater effect on foreign investors’ confidence in China than social unrest elsewhere in the country. Relative to the high stakes involved, the aggressive extent of the SOE restructuring is quite surprising.
Shanghai also led the way in the labor reforms of the state sector. Shanghai began to shed its workforce in the state sector very early, before the large-scale restructuring was rolled out on a national scale. Between 1990 and 1995, Shanghai was one of only three regions in the country that experienced negative employment growth. The other two regions were Heilongjiang and Qinghai. Also between 1990 and 1995, Shanghai had already begun to reduce its workforce in the SOEs, from 3.97 million to 3.24 million. In contrast, in the entrepreneurial provinces, the size of SOE employment, in fact, expanded during this period. In Guangdong, employment in the SOEs increased from 5.3 million in 1990 to 5.5 million in 1995; in Zhejiang, it increased from 2.8 million to 2.95 million.
That the two entrepreneurial provinces actually added state-sector employment, whereas the normally statist Shanghai reduced it, is a fascinating observation. It suggests that Shanghai's restructuring program was not used to jump-start private-sector development in Shanghai. Shanghai reduced state-sector employment while imposing restrictions on the private sector. A plausible explanation is that Shanghai restructured its SOEs to maximize the tax and income gains from the SOEs. The purpose of laying off SOE workers was to reduce the cost base of supporting the struggling SOEs and the purpose of restricting competition from private-sector firms was to raise the revenue base of the remaining SOEs.
1.5 Is Shanghai Innovative?
Stephen Green, an economist working at Standard Chartered Bank based in Shanghai, wrote that Shanghai authorities liked to treat foreign visitors to a tour of the Fuxing Group, a Shanghai-based private-sector pharmaceutical firm. The purpose is to showcase “Shanghai's vibrant private, high-tech economy,” Green (2003, p. 153) observed. But Shanghai's intentions erred in two areas – that Shanghai has a vibrant private economy and that its economy is high-tech. I have already shown that in terms of business income and income from holding assets, Shanghai is remarkably poor, not just in comparison with entrepreneurial Zhejiang and Guangdong but also in comparison with some of the poorest regions of China. In this section, I deal with the second of Green's observations – that Shanghai has a high-tech economy.
Shanghai Fuxing, the firm the Shanghai officials liked to showcase, is impressive but not at all for the reason that Shanghai claimed. The Shanghai firm has on its product portfolio a malaria-curing drug called Artesunate. In 2005, the World Health Organization (WHO) added this drug to its List of Pre-Qualified Medicines. This is the only indigenous Chinese firm on the WHO List of Pre-Qualified Medicines. (Another China-based firm on the list is the Chinese affiliate of Novartis.) To be certified by WHO is a major event for a firm because it signals the effectiveness of the drug and the reliability of the manufacturing process of the supplier. The standards used by WHO are identical to those used by the European Agency for the Evaluation of Medicinal Products and the US Food and Drug Administration.
But, to some extent, this was a hollow victory. For one thing, the fact that Artesunate is the only Chinese drug certified by WHO says something about the state of the pharmaceutical industry in China. On the WHO List of Pre-Qualified Medicines as of August 2006 – the list is updated regularly – there are eighty-three HIV/AIDs drugs supplied by five indigenous Indian firms and there are six tuberculosis drugs supplied by three Indian firms.14 As impressive as Shanghai Fuxing is within China, it lags substantially behind its Indian peers.
For another matter, strictly speaking, Shanghai Fuxing had very little to do with developing Artesunate. Artesunate is registered by Guilin Pharmaceutical located in Guizhou province. Shanghai Fuxing acquired Guilin Pharmaceutical a few years ago, long after the drug discovery and development were well underway. In fact, Shanghai Fuxing is not really a pharmaceutical firm. It is a holding firm of many diverse assets. It operates in four unrelated areas – pharmaceuticals, real estate, steel, and retailing. Its founder has no background in the life sciences. He received a PhD degree in Chinese philosophy from Fudan University.15
The real reason that foreign visitors were repeatedly taken to tour the Fuxing Group is that there are so few prominent private-sector success stories in Shanghai. Shanghai has always fashioned itself as a leader of technology in China; as the pride in the Fuxing Group testifies, but its achievements seem to fall short of its ambitions or its capabilities. Beijing, not Shanghai, dominates the list of the technological startups that have gone public on the NASDAQ. As of 2006, there were 23 NASDAQ-listed firms based in China, of which 13 were based in Beijing and 6 were based in Shanghai.16
Let's examine Shanghai's technological development on the basis of a systematic and comprehensive measure – patent grants.17 Patenting is widely used by economists as a measure of the innovations or competitiveness of firms or regions. The idea behind such a use is complex, but the main motivation stressed in the literature is that firms are motivated to build up their intellectual property rights in order to gain a competitive edge in the marketplace. Thus, patenting is a good measure both of innovativeness and of competitive business dynamics. Shanghai turns out to be terrible in terms of patenting activities and this is especially noteworthy considering the following two factors. One is that Shanghai started out as a leader in patents in the 1980s but ended as a laggard in the 1990s. The other is that Shanghai was showered with resources from the central government. With massive investments, a world-class infrastructure, and substantial FDI inflows, Shanghai does not seem to have much to show in an area that increasingly matters in China's competitive economic landscape – the ability to innovate and to upgrade technology and products.
In 1987, there were 575 patents awarded to individuals and institutions located in Shanghai. (All patents used in this chapter refer to patents granted by the Chinese patent authorities. Unless otherwise noted, all the patent data refer to annual patent grants rather than patent applications.18) This was second in the country, after Beijing (776 patents granted). In just four years, in 1991, Shanghai's position had slipped to No. 9 in the country in terms of the number of patents granted. Shanghai, with 1,025 patents, was not just behind Beijing (2,369 patents) but also behind two of China's largest agricultural provinces, Hunan with 1,174 patents and Sichuan with 1,232 patents.
The overall ranking is one indicator of what happened to Shanghai's innovative capacity in the 1990s, but it is not the most telling one. The more telling comparison is to benchmark Shanghai against provinces that have followed an entrepreneurial growth model. Let's compare Shanghai with Zhejiang and Guangdong. Figure 4.3 presents the ratios of Shanghai's annual patent grants to those of Zhejiang and Guangdong, respectively. Panel (1) of Figure 4.3, graphing the ratios of all the patent grants from 1987 to 2005, shows a steep decline in Shanghai's patent ratios relative to Zhejiang and Guangdong between 1987 and 1991. In 1987, Shanghai had about three times the number of patent grants as Guangdong and 1.8 times that of Zhejiang. In 1991, the ratios were below one for both the Shanghai/Zhejiang and Shanghai/Guangdong pairs.

Figure 4.3. Patenting activities in Shanghai, Zhejiang, and Guangdong. Panel (1): All patent count ratios: Shanghai/Zhejiang ratio and Shanghai/Guangdong ratio. Panel (2): Invention patent ratios: Shanghai/Zhejiang ratio and Shanghai/Guangdong ratio. Sources: The ratios are based on data from the NBS and Ministry of Science and Technology (1999 and 2002).
Hu and Jefferson (2006) note “a patent explosion” in China since 2000. The fact is that Zhejiang and Guangdong experienced a patent explosion at least 10 years earlier. Like many economists, Hu and Jefferson (2006) attribute a large effect to FDI but this pickup in patenting activities in Zhejiang – almost without any FDI – is more difficult to explain. (So is the absence of a patenting explosion in Shanghai, a city with abundant FDI.) Another item in Hu and Jefferson's paper better explains our finding. They find that private-sector firms have a higher propensity to patent than either SOEs or FIEs.
This entrepreneurial explanation accords well with the fact that Shanghai struggled throughout the 1990s. Its ratios relative to Zhejiang and Guangdong declined throughout the decade, although at a more gradual pace compared with the late 1980s. Except for a blip in 2003, Shanghai consistently under-performed both Zhejiang and Guangdong. The ratio vis-à-vis Zhejiang was always smaller than one, except for 2003, and it was less than one vis-à-vis Guangdong in all the years between 1990 and 2005. Shanghai recovered somewhat vis-à-vis the other provinces in the late 1990s. Its patent ranking hovered between No. 9 and No. 10 in the first half of the 1990s and then between No. 6 and No. 8 in the second half of the 1990s. In 2004, Shanghai's ranking improved to No. 4 in the country, after Guangdong (No. 1), Zhejiang (No. 2), and Jiangsu (No. 3). Shanghai was able to stem the decline of its technological position, but it still did not recover its previous position of technological leadership in the mid-1980s.
Panel (2) includes only what are known as invention patents and excludes the two other categories of patents, utility models, and designs. Invention patents go through a more rigorous examination for utility, novelty, and non-obviousness. The utility model and design patent applications are held to a less rigorous scrutiny. Incremental improvement, rather than novelty, is sufficient for these two categories. The period of coverage is longer for invention patents. Under Chinese Patent Law, invention patents enjoy protection for 20 years, whereas the protection is only for 10 years for the utility and the design categories of patents.19
It is important to separate the invention patents from the other two categories of patents to see if Shanghai managed to maintain its edge in a more exacting innovative activity. It turns out that Shanghai lost much of its initial and substantial lead in invention patents as well. Its decline vis-à-vis Zhejiang and Guangdong was less steep and less linear, as the staggered lines in Panel (2) show. But, a clear downward trend is visible in the graph. The sharpest decline again was in the late 1980s, although, compared with the utility model and design patents, Shanghai largely stemmed its decline vis-à-vis Zhejiang but not vis-à-vis Guangdong in the second half of the 1990s.
Shanghai has many advantages, so this decline is quite puzzling. It started with a huge edge over Guangdong and Zhejiang in the mid-1980s when it commanded more resources that went into the production of patents. It had far more engineers, scientists, and universities than Zhejiang and Guangdong. In 1981, for example, there were 87,000 college students enrolled in Shanghai. Zhejiang and Guangdong had about half this number.20 In 1981, in terms of engineers, the ratio of Shanghai to Zhejiang was 2.8 and to Guangdong 1.6. The gap was even greater in terms of the number of research scientists. The ratio of Shanghai to Zhejiang was 5.9; the ratio of Shanghai to Guangdong was 2.37. Shanghai also spent far more on R&D. The earliest figures we have are for 1992 and the data cover the R&D spending of only the large and medium industrial enterprises. Shanghai firms spent 2.4 times more on R&D than Zhejiang firms and 1.89 times more than Guangdong firms (see NBS 1993b, Table 18–59, p. 759).
Policy and legislative developments at the national level also should have been favorable to Shanghai. In 1993, the Chinese Patent Law was amended to extend protection to previously uncovered areas, such as pharmaceuticals, food, beverages, flavorings, and chemical compounds. In many of these areas, Shanghai firms possessed formidable preexisting capabilities. Yet, Figure 4.3 shows no pickup of patenting activities in Shanghai vis-à-vis Zhejiang and Guangdong since 1993.
Are there factors other than the entrepreneurial dynamics that may explain Shanghai's decline? One alternative explanation is that Shanghai's decline is simply a function of a natural process of technological diffusion whereby technologies originate in the advanced regions and then diffuse to other areas. The diffusion explanation would predict a relatively gradual and steady decline, but Shanghai's decline is very compressed. The sharpest decline occurred in the late 1980s and the early 1990s. Also inconsistent with the diffusion explanation, technological diffusions should first occur in the simpler category of patenting activities, such as utility and design patents, as the technological laggards climb up the learning curve. But, as we have seen in the data, Shanghai's decline was across the board, not just in the area of utility and design patents but also in terms of invention patents.
An alternative explanation is a measurement error. In our findings, we are comparing the absolute number of patent grants in Shanghai with those in Zhejiang and Guangdong. One may wish to point out that Guangdong and Zhejiang have a larger population and, therefore, they have a larger number of institutions and individuals involved in generating patents. But this explanation is not quite right either. Keep in mind that the phenomenon we are discussing is a reversal of Shanghai's fortune, not a permanent under-performance of Shanghai against the other two provinces. That Guangdong and Zhejiang have a larger population is a constant, not a variable. To identify the reason for Shanghai's reversal, we would have to locate a causal factor that has changed over time. In the end, it is not the total number of firms or individuals that matter for patenting activities; it is the number of inventive and innovative firms or individuals that matters. This is the crux of the matter – What explains the larger number of innovative and inventive firms and individuals in Zhejiang and Guangdong? One explanation is that these two provinces have a business environment that innovative firms and individuals find attractive.
2 Missing Entrepreneurship in Shanghai
Starting from last June, more than 7,000 private enterprises have moved out of Shanghai. Many of these Zhejiang entrepreneurs moved their headquarters to Hangzhou and Hong Kong.…It is time that we need to change policy.
– Yu Zhensheng, appointed Party secretary of Shanghai in October 2007
In 1992, a book with the title Shanghai: Her Character Is Her Destiny became a best-seller in China. The Shanghai government sponsored the book project – its preface was written by Mayor Wang Daohan – to research the identity of the city. The theme is that Shanghai has a distinct culture characterized by “its great tolerance, diversity, individuality, and entrepreneurship.” The book goes on to assert that the renaissance of Shanghai owed much to this distinct cultural heritage.21
The claim that Shanghai is historically entrepreneurial is accurate. In the first three decades of the 20th century, Shanghai was the major business and financial hub of Asia, similar to or even more significant than the role of Hong Kong today. It was the home of the country's largest textile firms and banks and the founding venue of a number of firms that are still major MNCs in the world today. These include Hong Kong Shanghai Banking Corporation (HSBC) and American International Group (AIG). A very powerful illustration of Shanghai's rich entrepreneurial heritage is the near absolute dominance of the Hong Kong economy by industrialists who left Shanghai in 1949.22 During the take-off period of Hong Kong, the most important industry in Hong Kong was textiles. As recently as 1977, the industry produced 47 percent of the value of its exports and employed 45 percent of its workers. In the late 1970s, Shanghai industrialists owned 25 – out of a total of 30 – cotton-spinning mills in Hong Kong. Between 1947 and 1959, Shanghai industrialists created 20 out of the 21 cotton-spinning mills established in that decade. It is not an exaggeration to say that the Hong Kong miracle was a Shanghai miracle in disguise.
Today, Shanghai cannot claim any large-scale, well-known private-sector businesses. On the other hand, the city is at the bottom of the country in terms of our entrepreneurial measures. These two phenomena are closely linked with each other and they are a self-fulfilling prophecy created by its industrial policy approach toward economic development. Industrial policy always favors big, incumbent firms and in Shanghai, the large firms are not only subsidized, but also the small entrepreneurial businesses are restricted in terms of their access to market opportunities. Because Shanghai systematically discriminates against small firms, Shanghai's private sector never had the time, opportunities, or resources to grow from small to big, except in a few cases where private businessmen got big very quickly through corruption. (I return to the subject of crony capitalism in Shanghai in the concluding section of this chapter.)
The purpose of this section is to document and unpack this missing-entrepreneurship phenomenon in Shanghai. We rely on two datasets to do so. One is the urban and rural household surveys conducted by the NBS; the other is the private-sector surveys conducted by the All-China Federation of Industry and Commerce. The household surveys contain information on self-employed household businesses or single proprietorships. The private-sector surveys have information on larger and more established private-sector enterprises (siying qiye). Both types of businesses are entrepreneurial in the Chinese context.
The following is the main finding from the survey evidence: Shanghai appears to lack – almost completely – a microeconomic mechanism widely regarded as important for growth and innovation: private-sector entrepreneurship. Despite a rich history of creating some of the largest businesses in China and in Asia in the first part of the 20th century, the average size of Shanghai private-sector firms is among the smallest in the country by employment and is on the small side in terms of sales. Despite the image of the city as a high-tech hub, the private-sector firms in Shanghai, on average, are less likely to hold patents and/or hold fewer patents than private-sector firms based in the heavily agricultural, poor, and interior province of Yunnan. Fixed-asset investments by self-employed household businesses, after reaching a peak in 1985, collapsed in the second half of the 1990s.
The missing-entrepreneurship phenomenon is completely an artifact of policy, as Yu Zhensheng, the current Party secretary of Shanghai, pointed out. Yu, whose quote appears at the beginning of this section, recounted how the poor business environment of Shanghai drove out Alibaba – one of the most successful Internet entrepreneurial businesses in China – to Zhejiang province in the late 1990s. Alibaba first started in Shanghai. Shanghai should have thrived in entrepreneurship. It has history on its side, but it also has other huge advantages. It has a rich endowment of human capital. Its economic growth has been rapid and it has attracted a lot of FDI. It also has the agglomeration economics that economists believe to be important for economic and business development. The anecdotal “folk wisdom” in China is that people in Shanghai satisfy one particular definitional feature of entrepreneurs very well. According to Kirzner (1979), entrepreneurs are those who are particularly alert to business opportunities that often elude others. The reputation of Shanghainese is that they are well endowed with business acumen. Also, as I demonstrated before, Shanghai's unemployment was rising in the 1990s. To the extent that self-employment and paid employment are substitutes, we should expect to see increasing self-employment during this period. Other than policy factors, it is very difficult to think of a reasonable economic rationale why entrepreneurship should be missing in Shanghai.
The combination of high unemployment and restrictions on small-scale entrepreneurship during this period is especially intriguing. To the extent that this absence of entrepreneurship is a result of a deliberate policy, Shanghai did not at all follow what Western economists postulate as the essence of a gradualist strategy – delaying SOE privatization to avoid job losses while encouraging new entry (Roland 2000). Actually, Shanghai appears to have done precisely the opposite – aggressively downsizing the state sector while restricting entry.
Shanghai also fits with the analytical framework in this book to explain why capitalism developed in some regions but not in others. Shanghai is the consummate urban China. It is the progenitor of the industrial policy approach that China embraced in the 1990s at the national level. No other region in China better embodies complete domination by the urban, state-controlled China over the more market-oriented rural China than Shanghai. A group of Shanghai technocrats, who were direct political beneficiaries of the downfall of Zhao Ziyang and his associates, came to dominate Chinese politics and economic policy between 1989 and 2002. The divergence between GDP and welfare and the emaciation of rural entrepreneurship closely reflect the policy visions of this group of Shanghai technocrats.
2.1 Single Proprietorship in Shanghai
Single proprietorships are those businesses owned and operated by the owners themselves. They are also known as self-employment household businesses. Usually, these are on a very small scale. In China, a self-employed business is defined as one that has fewer than eight hired workers. In the 1980s, it was mainly this form of small-scale private businesses that propelled the growth of the rural economy. In the cities, they also began to mushroom quickly, setting up garment and noodle stalls in many areas. The ubiquitous presence of these small-scale entrepreneurs was a universe away from Russia, where entrepreneurial instincts were completely eliminated by the 70 years of communism.
But not in Shanghai. In this section, I show that this form of entrepreneurship is almost completely absent in Shanghai. I focus on the urban part of Shanghai. Our data come from the NBS urban household surveys conducted in 1991, 1994, and 2004. The NBS surveys are designed to track the living standards of households, not the performance of businesses. But this is precisely the appropriate venue to study entrepreneurship. In Asia, and in China particularly, capitalism runs in families. Many of the old commercial houses in Shanghai in the 1930s were all family affairs and the largest businesses in other ethnically Chinese economies, such as Taiwan and Hong Kong, are all family firms. To be included in the NBS survey, one has to be a long-term resident with a registration status in the surveyed city. This satisfies another requirement of our inquiry – that an entrepreneur has to be indigenous.
Two questions in the NBS urban household surveys bear on the question of entrepreneurship. One asks whether a respondent operates his own businesses; the other asks whether a respondent is employed by an individual business. The specific measure is the number of entrepreneurs or entrepreneurial employees per 100 households. For the first question, in 2004, Shanghai ranked third from the bottom among 31 provinces in China. For the second question, Shanghai fared better: It ranked 10th from the bottom. (That Shanghai has fewer entrepreneurs per household than entrepreneurial employees is in and of itself interesting.)
A comparison of the 2004 NBS survey with the NBS surveys in the previous years reveals that Shanghai's rankings vis-à-vis the rest of the country were always very low. It is easy to document the missing entrepreneurship in Shanghai in 1991. There was not a single self-employer in that year. Things improved a bit in subsequent years. In 1996, there were 2.3 self-employers per 100 urban households and in 2004 there were 5. But in terms of its relative rankings in the country, Shanghai was always in the bottom tier. It was No. 9 from the bottom in 1996 and No. 3 from the bottom in 2004.
Not only is entrepreneurial incidence low in Shanghai, those who choose to go into self-employment businesses in Shanghai also earn very little money compared with self-employers in other provinces. We already saw that Shanghai has a very low share of employee compensation in its GDP. In the Chinese data, employee compensation comprises two sources. One is the wage and benefits received by workers at paid establishments. The other source is what is known as proprietor income – income derived from owning and operating a business. (This is one major difference with the US data where income accruals, paid income, and proprietor income are reported separately. In the Chinese GDP data, they are combined.)
Fortunately, the NBS urban household surveys provide detailed breakdowns of household incomes and we can thus compare Shanghai's proprietor income with that of other regions in China. In 2004, urban self-employers in Shanghai reported their per capita business income to be 500 yuan. In contrast, urban self-employers in rich – and entrepreneurially oriented – provinces earned far more. In Zhejiang, the per capita business income in 2004 was about 1,400 yuan; in Guangdong, it was about 800 yuan. Guangdong and Zhejiang, however, are among the richest regions in China. A more surprising finding is that Shanghai also compares poorly with what are often viewed as laggard provinces. At 500 yuan, Shanghai was squarely in the same earnings neighborhood as Hunan, Ningxia, Anhui, and Yunnan. The GDP per capita of these four provinces is a fraction of that of Shanghai. In terms of their GDP per capita ratios to that of Shanghai (based on 2003 data), Hunan is 0.162 of Shanghai; Ningxia is 0.143; Anhui is 0.138; and Yunnan is 0.121.
This finding is very significant. Some may argue that NBS household surveys, because they do not cover unregistered migrants, may under-count self-employers in Shanghai. But this omission clearly does not explain why the income of self-employers in Shanghai is low. The low level of self-employment income supports the hypothesis that entrepreneurship is suppressed in Shanghai.
There is no good economic explanation for why urban entrepreneurs in Shanghai and Yunnan earned about the same amount of per capita business income. Yunnan is located in China's southwest and is one of the poorest provinces in China. In the 1980s and 1990s, the central government teamed the coastal and prosperous provinces with China's poorer provinces in the interior and western regions of the country. Shanghai was teamed with Yunnan.23 To illustrate how strange it is that urban entrepreneurs in the two provinces earned about the same amount of money, suppose a finding that self-employment incomes in the United States and Turkey were about the same. Turkey's per capita GDP in 2000 at US$3,000 was about 10 percent that of the United States, similar to the per capita GDP gap between Yunnan and Shanghai. The most plausible explanation is that Shanghai restricts its household businesses to the lowest value-added activities. It is not economics, it is policy.
2.2 Where Are Shanghai's Firms?
Let me turn to indigenous private-sector firms in Shanghai. These are larger, more established businesses compared with single proprietorships. But these are still entrepreneurial businesses in the context of China. They are the only category of firms in China without substantial ties to the government. (Even many foreign firms are joint ventures with SOEs.) They are very small. For example, in the private-sector survey of 2002 (PSS2002), the average number of employees was only 152 persons. This is far below the conventional World Bank 500-person cut-off threshold for large firms (Batra, Kaufmann, and Stone 2003). In an economy dominated by SOEs and, increasingly, by MNCs, indigenous private-sector firms are entrepreneurial in a Schumpetarian sense – these new private-sector firms challenge the market positions of the incumbent government-related firms.
They are also entrepreneurial because they are still start-ups. In PSS2002, of the 3,158 firms that provided data, only four had been established before 1980. The average age of the firms in the entire sample is only eight years. Shanghai has a younger cohort of firms. The average age in the Shanghai sample is only 7.1 years. One reason might be that Shanghai lagged behind the rest of the country in terms of development of entrepreneurial businesses, rather than a sampling bias targeting younger firms in Shanghai. As evidence, the 1993 survey also has this age difference between the Shanghai firms and the firms in the entire sample. In the 1993 survey (PSS1993), the average age of Shanghai firms is 5.3 years, compared with 6.9 years for all firms in the survey.
Many of the surveyed firms are still run by their original founders. In PSS2002, none of the firms is listed. The average number of shareholders is only 5.6 persons and the median number of shareholders is only 2. The largest number of shareholders is 54. So, unlike managers in SOEs and MNCs, the managers of these private-sector firms bear the residual risks and benefits of ownership. They also fit with a behavioral definition of entrepreneurship. The firms are very nimble, completely profit-driven and market-oriented. This is an attribute emphasized by writers such as Frank Knight (1921) and Israel Kirzner (1979). Previous research on entrepreneurship in transition economies treat this type of firm as a form of entrepreneurship (McMillan and Woodruff 2002).
The private-sector surveys are biased toward the large private-sector firms in China since the members of the All-China Federation of Industry and Commerce are more established firms. This bias is not a problem here because our priors are that Shanghai firms should be larger. We borrow insight from the economics literature that firm size is a function of the legal and financial environment of firms, not of other influences such as market size and industry characteristics (e.g., Kumar, Rajan, and Zingales 1999). According to this reasoning, Shanghai ought to have some of the largest private-sector firms given its large GDP, superior human capital formation, connections to international markets, excellent infrastructure, and the city's long history of creating some of the largest businesses in China and the world.
From the NBS household surveys, we have already seen that self-employment businesses in Shanghai are scarce and perform less well compared with their counterparts elsewhere. One could argue that the reason for this is that Shanghai has an efficient established private sector. So, Shanghai may have a size bias but it does not necessarily have a bias against the private sector per se. The city may be more favorably disposed toward large private businesses than smaller private businesses.
We measure the development of entrepreneurship by the employment size of a private-sector de novo firm. Employment size is probably the most common measure of firm size in the general economics literature (Kumar, Rajan, and Zingales 1999; Cabral and Mata 2003). There is a special reason to pay attention to employment size in the context of a transition economy. The ability to generate employment by entrepreneurial businesses at a time when the SOEs are shedding jobs entails enormous welfare implications. For this reason, economists studying entrepreneurial dynamics in transition economies focus on employment (Johnson, McMillan, and Woodruff 2000). During the 1990s, as Shanghai's economy was growing rapidly, the city lost a large number of jobs, as shown previously.
Table 4.1 presents data on various indicators of firm development across a number of survey years. Panel (2) of Table 4.1 presents data bearing on the size of private-sector firms. We have two indicators. One is the average and the median values of sales per firm; the other is the average and the median number of employees per firm. Panel (1) presents data on the urban per capita income of these regions and their percentage shares of nonagricultural employment. We present data from PSS1993, PSS2002, and PSS2004. All the findings reported in Table 4.1 are based on a descriptive analysis of the survey data. That is, these are the summary values of the indicator variables averaged over all the firms without considering firm-level characteristics. In the Appendix, I discuss findings based on a statistical analysis of the data; the results do not differ from those reported herein.
Table 4.1. The state of the indigenous private sector in Shanghai, various years

Notes:
a Based on the urban household survey data, not the national income accounting data.
b Referring to employment located in urban areas.
c Referring to those firms that hold patents.
Sources: The per capita household income data are from Urban Social and Economic Survey Team (1997). Employment data are from National Bureau of Statistics (2005a). Data on private-sector firms are from PSS1993, PSS2002, and PSS2004.
Shanghai under-performed in just about every dimension. Its firm size is not only smaller than that in rich and entrepreneurial provinces, such as Zhejiang and Guangdong, it is also smaller than the firm size in Yunnan. Recall the previous finding, based on the NBS household surveys, that the average business income and property income are higher in Yunnan than they are in Shanghai. Now, we know the reason why – Yunnan has a more developed private sector. Yunnan is much poorer than Shanghai. Urban income in Yunnan was about half of that in Shanghai in 1996, as shown in Panel (1), and the per capita GDP of Yunnan was a fraction of that of Shanghai because Yunnan has a sizable agricultural sector. Its nonagricultural employment is about one third of that of Shanghai. Yet, not only does Yunnan have larger private-sector firms, it has substantially larger firms compared with Shanghai. As shown in Panel (2), in 2003, Yunnan firms on average were 87 percent (38.8/20.8) larger by the sales measure and 457 percent larger (260.3/46.7) by the employment measure than Shanghai firms.
Shanghai firms look especially poor when firm size is measured by employment per firm. The average employment per firm in 2003 is 46.7. This compares with 260.3 persons in poorer and agricultural Yunnan and 299.8 persons in Zhejiang and 319.6 persons in Guangdong. The last row of Table 4.1 presents data on all the surveyed firms in China. Shanghai firms are smaller in sales and employment than the national average in all the years for which data are available, in 1992 and 2003.
In addition to the average size of sales and employment, I have included median values. Median values are a better reflection of the state of middle-sized firms than mean values. Several studies have shown that biased business environments often exhibit a “middle-sized firm” problem. The idea is that a difficult business environment is most detrimental to middle-sized firms because small firms are nimble enough to evade the regulatory imperfections and large firms have the political and financial power to overcome them. Middle-sized firms have neither.24
Shanghai exhibits a classic symptom of a “middle-sized firm” problem. The median values of sales and employment are much smaller than those indicated by the mean values. Take as an example the Zhejiang/Shanghai comparison. Measured in terms of sales, the Zhejiang/Shanghai ratio in 2003 was 4.4 for the average measure but 5.2 for the median measure. The differential between the mean and median measures is of a similar magnitude for the other paired comparisons as well (i.e., the differential in the median measure is always larger than the differential in the mean measure).
The employment measure reveals an even more remarkable development: The median employment declined for Shanghai firms between 1992 and 2003. This is telling on several accounts. One is that the average employment rose during the same period, suggesting that Shanghai's business environment eased for large firms but not for smaller firms. Second, Shanghai bucked the national trend. In the dataset as a whole, both the average and median employment rose between 1992 and 2003, but the median employment declined for Shanghai. This relative decline is striking because the period between 1993 and 2003 is usually regarded as the golden decade for Shanghai's economy. Nominal GDP expanded from 111.4 billion yuan in 1993 to 540.8 billion yuan in 2002. Between 1993 and 2002, real GDP grew in excess of 11 percent in every year. FDI increased from US$2.3 billion to US$5.03 billion.25 It is curious that median firms located in this richest and fastest-growing market failed to take off.
We have already seen that Shanghai lagged behind Guangdong and Zhejiang in terms of aggregate patent grants. Here, we want to see if private-sector firms in Shanghai are more or less innovative than private-sector firms elsewhere. Both PSS2002 and PSS2004 asked respondent firms whether they held any patents. Shanghai firms in the 2002 survey show up very poorly in this respect. Fewer Shanghai firms held patents than in the national average. In the survey, 15.3 percent of Shanghai firms responded that they held patents, compared with 16.6 percent of all the firms in the survey. To the extent that they held patents, Shanghai firms in the 2002 survey held fewer patents than the national average. The average number of patents held by Shanghai firms was 3.7, compared with a national figure of 3.9. The number for Zhejiang was 5.2 and it was 5.7 for Guangdong. The 2002 survey also asked firms whether they developed products on their own. In response to this question, 28 percent of Shanghai firms said yes, compared with a national average of 34.2 percent. Interestingly, by this measure, Shanghai under-performed significantly against both rich provinces – Zhejiang and Guangdong – and poor provinces such as Yunnan. The findings based on the PSS2004 are very similar.
2.3 Does It Matter?
Economists and other scholars studying transition economies have conflicting views about the economic and political merits of mass privatization, financial reforms, and foreign-trade reforms. Few, however, would dispute the vital importance of fostering the development of new entrepreneurial businesses. Entrepreneurial businesses – defined as new entrants and as privately owned – create jobs and promote growth at a time when SOEs are downsized and retrenched. The de novo businesses also inject a much-welcomed dose of competition into economies that have poorly functioning product and factor markets and that are saddled with government distortions. It may be axiomatic for economists that entrepreneurship matters enormously for economic growth. China is not an exception. In the 1980s, rural incomes and economic growth improved rapidly because of rural entrepreneurship. The lack of this growth mechanism in Shanghai amidst surging GDP naturally leads to the question, “Does it matter not to have entrepreneurs?”
To get at this question, we revisit the issue of the divergence between GDP and personal incomes. We saw earlier that in Zhejiang, GDP growth and personal income growth tracked each other closely and that in Shanghai, the two diverged. The contrast between Shanghai and Zhejiang illustrates why entrepreneurship matters: Entrepreneurs promote economic growth because they are motivated to improve their own economic well-being. There is a built-in incentive mechanism for growth. State-led GDP growth can still be fast in Shanghai – and, it should be pointed out, in certain periods of the Soviet Union – without private incentives due to the huge government investments. This type of GDP growth is not sustainable and is less welfare-improving. In China, entrepreneurs tend to come from the least-privileged segment of the society. This is another cost of suppressing entrepreneurship – GDP growth can be anti-poor. As we saw already, the poorest people in Shanghai have lost absolutely since the late 1990s.
Is there a connection between the missing entrepreneurship and Shanghai's poor innovative capacity? Again, missing entrepreneurship means missing incentives. Shanghai is particularly poor in those innovative activities that convert inventions into useful commercial applications, as compared with entrepreneurial Zhejiang and Guangdong. There is an important distinction between being inventive and being innovative: Inventions are acquisitions of capabilities without reference to their underlying market value; innovations are acquisitions that are motivated by a realization of market values (Iacopetta 2004). A top-down bureaucratic system, such as that in the former Soviet Union, can be quite inventive because of massive investments in science and technology by the government. According to Iacopetta (2004), the former Soviet Union pioneered in cutting-edge research in a wide range of fields, as compared with the Western countries.26 The problem is that the economy was not innovative in new technologies and processes to convert the scientific breakthroughs into useful commercial applications. The massive R&D expenditures had very little effect on the economy as a whole.
Shanghai exhibits the classic Soviet syndrome – it is inventive but not innovative. In 2005, universities, research institutes, and government agencies in Shanghai were granted 1,895 patents. This is substantially more than in Zhejiang (841) and Guangdong (644), despite the fact that Zhejiang and Guangdong both had larger total patent counts. Because these are non-profit institutions, these are inventive activities without reference to their market value. Shanghai under-performed in the more market-oriented patenting categories. In 2005, there were 8,486 patents granted to firms in Shanghai but there were 11,518 granted to firms in Guangdong. (Zhejiang had far fewer than Shanghai: 3,892.) The greatest difference between Shanghai and these two other provinces lies in the number of individual patent grantees. In 2005, Shanghai had only 2,222 individual patent grantees; this does not even begin to compare with Zhejiang (14,333) or Guangdong (24,732).27
In one respect, Shanghai is fundamentally different from – and superior to – the former Soviet Union: Shanghai is open to FDI. So, the question is not whether it matters to have entrepreneurs but whether it matters not to have indigenous entrepreneurs. The answer is still yes, although the reasoning is a bit more complicated. The essence of the Shanghai model is to restrict the opportunities for Shanghai residents to become capitalists but to create an efficient and attractive platform for foreign capitalists to set up production facilities. This explains the paucity of asset returns to the average Shanghai households in the NBS household survey data. But, the low entrepreneurial income is partially compensated for by the fact that MNCs can offer a substantially higher level of wages than the majority of indigenous entrepreneurs. This again is consistent with the NBS household survey data that shows the average Shanghai residents to have the highest wage level in the country. The average Shanghainese are the richest proletariat in the country but among the poorest capitalists in the country. So, one can argue that it is a wash – that lower profit incomes are made up for by higher current wage incomes.
The Shanghai model will come back to haunt Shanghai if there is an external shock. One form of such external shock might be the rise of India as an attractive FDI location or the rise of other regions in China that can compete with Shanghai. Local firms have a home bias in that they have a preference to operate in their home base. The most detrimental aspect of the Shanghai model is that it has damaged the ability of local firms to attract top human talent. One of the few ways that local entrepreneurial businesses can successfully compete with the deep-pocketed MNCs in the talent market is that they can offer greater future payoffs – stock options or career paths to the top of the corporate hierarchy. (This is basically how Indian firms such as Infosys and Wipro were able to compete with IBM and GE to recruit and retain the best engineering talent in the country.) Suppressing the growth potentials of local entrepreneurs caps the value of the upside option these local entrepreneurs can offer to attract human talent. If the perception in the market is that these local businesses cannot grow big, then these local firms will have no choice but to compete on the basis of offering current payoffs. MNCs command a decisive advantage in competition on the basis of current payoffs. Greater talent flows to the MNCs will then reinforce their policy advantages and further solidify their market dominance.
3 Understanding the Shanghai Model
If I am not mistaken, in our country, private businesses contribute 40 percent of GDP. In our Shanghai, SOEs create nearly 80 percent of Shanghai's GDP. Who upholds socialism most rigorously? Who else if it is not Shanghai?
– Quote attributed to Chen Liangyu, the Party secretary of Shanghai from 2002 to 2006 (sentenced in 2008 to 18 years in jail for corruption)
Recall the finding that Shanghai relinquished its technological edge during the four-year period between 1987 and 1991. In 1987, Shanghai ranked No. 2 in the nation in terms of patent grants; in 1991, it ranked No. 9. This period thus warrants special attention. A central theme in this book is that China reversed many of its reforms in the early 1990s. There was a similar reversal in Shanghai, except that the reversal occurred five years ahead of the rest of the country. A little-known fact is that while Shanghai lagged behind the rest of the country in terms of reforms, Shanghai did implement meaningful reforms in the first half of the 1980s.
We again go to an indicator that reliably tracks private-sector policy developments – fixed asset investments by the individual economy. The individual economy refers to those business units run by single proprietors or self-employers.28 The patterns are quite striking. Consistent with the portrayal of Shanghai as liberalizing in the first half of the 1980s, the share of the individual economy rose from 3.2 percent in 1978 to a peak of 10 percent in 1985. For the country as a whole, as we saw in Chapter 1, during the first half of the 1980s, the fixed-asset investments by household businesses already reached 20 percent. Thus, Shanghai was lagging behind the rest of the country but it was moving in a liberal direction in the first half of the 1980s. This is an important detail because much of the policy reversal documented in this book is associated with those leaders who came to Shanghai in the second half of the 1980s.
Descriptive accounts confirm this statistical portrayal. According to a 1986 State Council (1986) report on household businesses, by 1985, small daily consumer items traded in the private-market fairs in Shanghai already accounted for 77 percent of the total transaction value of these product groups. There were 1,558 so-called alliance businesses – a code name for the larger private firms at the time. The average number of employees was 12.6 persons, exceeding the seven-employee rule; 25 private businesses employed 50 to 100 each and some even employed more than 100 employees.29
Recall the case of Mr. Nian, who, as a private entrepreneur, was able to crack into Shanghai's food market in the early 1980s. In the late 1970s, Shanghai was already beginning to forge market ties with firms based in other provinces. Naughton (1996, p. 113) documents that the marketization of Shanghai's machinery firms – the most important in the country – began as early as the 1970s. In the 1980s, the central government substantially cut its investments in this sector and encouraged firms to create their own linkages with suppliers and customers. Shanghai led the way in this effort. In 1979, the State Council chose a number of SOEs in the country to experiment with profit-retention schemes. Because the program aimed at reforming the larger SOEs, the coverage of the program in Shanghai was quite large. According to Shirk (1993, p. 202), the Shanghai SOEs included in this reform program accounted for 80 percent of the total profits in the city.
The 1980s are commonly viewed as unfavorable to Shanghai. According to this view, the central government taxed Shanghai heavily. Although the view is mostly valid, it does not mean that Shanghai did not implement any reforms. (In the 1980s, Shanghai was taxed heavily but it was also a recipient of other forms of support. I present some data in the Appendix to illustrate this point.) In the early 1980s, Shanghai also experimented with shareholding reforms. Firms issued freely tradeable equities to investors. Shanghai led the country both in the launch of these financial instruments as well as in the size of their issuance. By 1984, 1,700 issues were recorded in Shanghai, totaling RMB 240 million (Walter and Howie, p. 23). This was a large amount of capital considering the overall size of fixed-asset investments at the time. In 1984, Shanghai's fixed-asset investments amounted to 9.2 billion yuan. In 1986, the Shanghai municipal government permitted the establishment of a new local bank that would directly compete with the incumbent state-owned banks (Harding 1987, p. 123).
The year 1985 marked the peak of private-sector development in Shanghai, at least as measured by the fixed-asset investments Shanghai's ratio of 10 percent in 1985 of fixed-asset investments by household businesses to the total fixed-asset investments would not be exceeded again. The ratio declined sharply to 7 percent in 1986, then to 5.8 percent in 1991, and to only 1.1 percent in 1993. (This period, as we saw earlier, also coincided with a sharp decline of Shanghai's patenting edge.) During the next 10 years, this ratio steadily declined further from an already negligible level in 1993. In 2004, the share was 0.2 percent. At 0.2 percent, this is less than one tenth of the level in 1978. The turning point thus seems to be around 1986.
The second half of the 1980s was a critical period for Shanghai and, as the circumstances would have it, for China of the 1990s. During this period, Shanghai set out some of the key elements of the top-down Shanghai model that we are familiar with today. The Pudong project, the essence of which rested on a massive taking of rural land, huge government investments, and subsidization of FDI, was formulated in the 1986–1987 period and won central approval in 1990 (Yatsko 2004). Urban control of the rural economy was tightened during this period under the doctrine of “rural–urban planning integration.” (I go into detail about this later in this section.) The Shanghai leaders who ruled over Shanghai during this period were two of China's consummate urban technocrats, Jiang Zemin (1985–1989) and Zhu Rongji (1987–1991).30 Under their leadership, Shanghai's private entrepreneurship declined sharply and Shanghai relinquished its patenting edge. With this kind of record behind them, they moved on to Beijing to govern China for the entire decade of the 1990s and beyond.
The Shanghai model has four integral components. The first is a highly interventionist state. The quote from former Party Secretary Chen Liangyu at the beginning of this section reveals this aspect of Shanghai. The second is a systematic and deep anti-rural bias in its economic policies. The third component is a biased liberalization in favor of foreign capitalists at the expense of indigenous capitalists. The fourth component is that Shanghai was favored by the central government and might have been showered with massive resources. The components of this model together produced rapid GDP growth but poor household income growth. In the following paragraphs, I mainly focus on the first three components of the Shanghai model we have fairly good data to illustrate them. I offer a conjecture about the fourth component in the concluding section of this chapter.
3.1 The Very Visible Hand of the State
Shanghai is a classic industrial-policy state. The industrial-policy approach comes in two related forms. One is that it is a highly interventionist government. The government sets ambitious policy visions and uses all of its administrative tools to accomplish them. In an otherwise positive assessment of Shanghai, two World Bank economists caution that Shanghai is too ambitious (Yusuf and Nabeshima 2006). The other is that this is a government with a lot of power. Foreign businesspeople often marvel at the ability of Shanghai to “get things done.” World-class infrastructure can be built overnight and an entire neighborhood can be uprooted in a flash. There are no public hearings and eviction orders are carried out swiftly and, if necessary, forcibly. (The mayor of Beijing expressed an attitude that surely would be appreciated in Shanghai as well, “We never forcibly evict anybody, except those who refuse to move.”)31
But, the hand of the state was not always so encompassing in Shanghai. As we saw earlier, in the first half of the 1980s, Shanghai was moving in a liberal direction. We also saw that rural household income in Shanghai relative to the rest of the country was rising between 1983 and 1993. This is entirely to be expected. Rural residents located in the proximity of the rich market of Shanghai should reap enormous income gains. The precondition for this pulling effect of the urban center to work is the existence of a market economy.
My conjecture is that the policy turning point occurred sometime around 1986. Some documentary evidence suggests that the blueprint for the top-down Shanghai model was established around this time. A 1987 government document might be the policy genesis of the Shanghai model: “A comprehensive development program for Shanghai” drafted by the municipal government. The program laid out many of the key elements of Shanghai's aspirations to transform itself into a world-class city in short order. The document did not include specific details about what would become the famous Shanghai landmarks in the 1990s, such as the Pudong district, the Maglev train, and so on. The 1987 document set forth a rationale that came to justify these highly costly projects – Shanghai was to join the ranks of the global, world-class cities by the early 21st century. Considering that Shanghai had a per capita GDP in 1987 of less than US$800, this was an extraordinarily ambitious goal.
The 1987 development program established two key mechanisms to leapfrog Shanghai. One was the internationalization of the Shanghai economy, not just any internationalization but one based on advanced technology and global brands.32 The other mechanism was a systematic push to eliminate all vestiges of those extant features of the city considered to be backward by the policy elites. These included those small and informal market activities that were a ubiquitous sight in urban China in the 1980s – food and vegetable stalls operated by peasants at the intersections of cities and the countryside. In the first half of the 1980s, many spontaneous marketplaces had sprung up in various neighborhoods in central Shanghai, hawking goods ranging from vegetables and eggs to small-scale industrial goods, as detailed in a province-by-province study of self-employment businesses (State Council 1986). This is the sale or the demand side of the rural entrepreneurship miracle documented in Chapter 2. But, to the urban technocrats eager to project their city as an ultra-modern metropolis, these messy marketplaces represented not income-earning opportunities for rural merchants but rather unorganized, unlicensed, and unsightly activities to be stamped out.
The 1987 development program set up a bureaucratic mechanism to systematically cleanse Shanghai of these backward vestiges – a super municipal agency headed by the Shanghai mayor himself. This agency centralized all urban-planning decisions. The Pudong project, which was to convert an area of 350 square kilometers of farmland into a financial and commercial center in very short order, was first conceived of by this agency. The essence of the Pudong model is deceptively simple: The government, as the monopoly buyer facing no competition, was to requisition vast tracts of land from rural households at below-market prices and then auction off the land-use rights at prevailing market prices. The proceeds from the land sales were then used to finance the government's industrial policy programs, welfare and pension obligations, and last, but not the least, corruption.
The idea embodied by the Pudong project is what is known in the 1987 development program as “the rural–urban planning integration.” As the name suggests, the idea was to closely coordinate planning of rural and urban economic affairs. It is worth elaborating on the implications of this seemingly simple planning conception. First, the reforms in the rest of the country and in Shanghai itself until the mid-1980s followed a so-called “two-track” approach – market reforms, private-sector development, and even financial liberalization in the rural areas but persistent central planning in the urban areas. The rural–urban planning integration implied an abandonment of this approach and the adoption of a single-track approach.
Second, the reformist leaders in the 1980s, Zhao Ziyang especially, advocated an extension of the mechanisms of the rural reforms to the urban areas when they began to contemplate how to reform China's industrial sector. Fixed, lump-sum taxation and enterprise contracting were both products of the rural reforms that the reformist leaders wanted to replicate in the cities. The policy intention – if not the actual result – was to converge the urban track with the rural track rather than the other way around. (To be historically accurate, let's keep in mind that time was not on Zhao Ziyang's side to implement his policy visions. He lost much of his economic decision-making authority in late 1988 and was purged in June 1989.)
In Shanghai, the rural–urban planning integration amounted to the convergence of the rural track to the urban track. In the 1980s, urban Shanghai was substantially state-owned and controlled. As we saw previously, the 1991 NBS urban household survey did not uncover a single incidence of urban private household business in Shanghai. By contrast, in the urban areas of Guangdong, there were 6.47 self-employed businesses per 100 urban households. Relative to the urban areas, rural Shanghai had a higher level of a market economy. The non-farm rural business income was rising in Shanghai relative to the rest of the country throughout the 1980s. The rural–urban planning integration meant a complete domination by the state-owned urban economy of the (relatively) market-oriented rural economy.
A number of indicators suggest that rural entrepreneurship began to slow down as soon as the 1987 development program went into effect. We saw earlier that fixed-asset investments by household businesses, as measured in terms of their share of the total, reached a peak in 1985. Almost all of the fixed-asset investments were rural in origin. In 1985, the rural share was 98 percent of the total (and 95 percent of the total in 1995). We can also look at this issue by examining the real absolute amount of the household fixed-asset investments. (The deflator is the Shanghai consumer price index to the 1978 price levels.) In yuan amount, the peak was reached in 1988 when investments reached about 1 billion yuan (all in the 1978 prices). In 1989, it was below 800 million yuan and in 1993 it was 230 million. After a brief surge in 1996 and 1997, in real terms, the fixed-asset investments made by individual economy units simply disappeared. In each year after 2000, the investment level was below 200 million and, in 2004, it went down as low as 120 million yuan. This is exactly where Shanghai was in 1979 – at 110 million 1978 yuan, right back to the era of central planning. The emaciation of small-scale entrepreneurship was now complete.
The invisibility of entrepreneurship is the flipside of the visible hand of the state. There are telltale signs. Shanghai has very high tax rates. Several researchers have reported how Shanghai seemed to tax its firms beyond the tax quota specified by the central government. So, the high tax rates in Shanghai were not only designed to meet the central tax mandate but also to meet its own expenditure needs. There is evidence that the tax burdens have become more onerous over time. For example, Whiting (2001, p. 98) reported that Nantang Township of Jiading county in Shanghai did not aggressively tax private enterprises until 1989 when the tax-sharing rule was revised. Under the old rule, taxes collected from private enterprises had to be turned over to the county level, leaving few benefits for the township from heavily taxing private enterprises. Under the new rule, tax revenue above a set quota was shared between the township and the county.33
Another indicator is an extraordinarily puzzling pattern in the NBS urban household survey data: The average Shanghai households derived very little income from real estate rentals. In 2004, amidst China's hottest real estate market, Shanghai per capita urban rental income was only 157 yuan. This is 1.8 times the national average and only 0.81 and 0.62, respectively, of the urban averages in Zhejiang and Guangdong. That the average Shanghai households appeared to have derived modest gains from the country's most prosperous property boom is suggestive of the regulatory restrictions on the rental market. Shanghai pioneered the practice of massive urban renewal projects. Entire neighborhood blocs involving hundreds of thousands of residents were demolished to make way for new construction. The Pudong project, for example, involved relocating and resettling some 1.7 million people. According to one estimate, between 1992 and 1997, the government demolished 22.46 million square meters of building area and 541,400 households were displaced (Zhang 2002).34 (Until the late 1990s, such urban construction programs were less frequent in Zhejiang and Guangdong, although in more recent years, this highly destructive practice began to be emulated elsewhere in the country.)
The staggering scale and rapidity with which urban renewal was carried out in Shanghai suggests a highly interventionist and often coercive role of government. One policy tool is strict business licensing. In 2004, China conducted an economic census of all businesses including those that were unregistered. Shanghai has the highest ratio of registered businesses in the country. This is not a reflection of a liberal business environment in Shanghai but rahter a strict enforcement of all the rules on the book pertaining to business registration. My interviews in Shanghai uncovered a range of highly restrictive policies toward household businesses in Shanghai.35 These restrictions only began to ease in 2005. Following is a summary of some of these policy restrictions:
- The Shanghai government imposed onerous restrictions on who could start a second job as a private entrepreneur. University professors, civil servants, SOE general managers, and workers for the non-profit organizations were not allowed to start private businesses on the side. They had to quit their current jobs, the effect of which is that it took away the risk insurance that comes with a regular job, an insurance that was necessary at the beginning of the reforms. Since 2005, this restriction only applies to civil servants.
- The government imposed a registration capital requirement and required entrepreneurs to register the entire amount of the capital requirement on the day of registration. Thus, a potential entrepreneur would have to show the proof of the requisite capital rather than being able to pay in the registered capital by installments.
- Shanghai has very strict zoning regulations. Residential apartments cannot be used for commercial purposes and if a resident rents out residential space on commercial lease, it has to be approved by the government. The government enforces this law rigorously. One effect of this policy is that it raises the business and rental costs of household entrepreneurs.
- Shanghai government tightly controls land transactions. A concrete indicator is that in the demolition business – a huge business now in Shanghai as the city demolishes many old buildings to build new structures – all the firms are completely state-owned. This shows the intention of the Shanghai government to strongly control land allocation.
- In the critical infrastructure projects, the Shanghai government explicitly forbids private-sector firms from bidding for the projects. Because much of the GDP growth in Shanghai in the 1990s was generated by these investment projects, private-sector firms missed out on one of the key growth areas of the economy.
- Shanghai government favors FIEs – firms with at least 25 percent of foreign equity – both explicitly and implicitly. One implicit form of policy favoritism is that the Shanghai government allows FIEs to deduct the actual payroll costs from their tax liabilities. Domestic firms are allowed to deduct their payroll costs only to the extent of an average level specified by the government. The government purposely sets a lower level of salaries compared with the market rate, thus limiting the deductions by domestic firms.
- The World Bank does not classify China as having onerous business licensing procedures, as compared with other transition economies. The length of time to start a business is about 40 days and to register a business, 30 days. This is substantially better than Vietnam, where it could take six months to set up a business (McMillan and Woodruff 2002). The World Bank's reporting is based on China's business licensing regulations. A close reading of these regulations and other accompanying documents at several business licensing offices in Shanghai reveal how misleading this classification is. The 40-day length refers to the amount of time required by the licensing office to notify an applicant whether his application for license is approved. However, before the business is eligible to apply for a license, an entrepreneur needs to assemble a large number of documents from numerous government agencies. For example, if an entrepreneur intends to set up a stall in a location, she has to obtain a permit from the agency in charge of that location. She also has to obtain certificates from health and labor bureaus. If she cannot provide a separate business address from her home address, she has to provide documentation that her home has been approved by the government for dual residential and business uses.
- The licensing office accepts an application for a business license only after all these documentation requirements are satisfied. A number of entrepreneurs commented that while these documentation requirements are uniform across China, they are being enforced with rigor in Shanghai.
The tight government control may explain both the paucity of the entrepreneurial supply in Shanghai as well as the modesty of the rental income accruing to the average Shanghai households. Consider the following characteristic of the urban private-sector activities: They are likely to cluster in the commercial sector, such as retail shops and restaurants, and so forth. There are two attributes of economic activities in the commercial sector. One is that they thrive in places with high population density; the other is that the location factor is an important determinant of business success. The nature of real estate regulations is likely to have a substantial impact here. Restricting the access of small private entrepreneurs to retail space has a double-whammy effect of constraining the development of urban private entrepreneurs as well as reducing the demand for rental property. We saw the effect of the former dynamic in the data on the paucity of single proprietorships in Shanghai and now we have a theory to explain why the average rental income of Shanghai households is so low.
3.2 The Consummate Urban China
Shanghai is the ultimate symbol of urban China. It has a very large urban population and the city boasts practically all of the amenities associated with a rapid pace of urbanization – infrastructures, skyscrapers, elevated highways, and Starbuck cafés. The Shanghainese are said to be urbane, sophisticated, and very wired. The city, according to The Economist, is now beginning to set international fashion trends.
Being urban in this book does not just refer to a geographic or demographic characteristic; it is also an ideology. At the political and economic levels, urban China represents the strong hand of the state, a heavy interventionist approach toward economic development, an industrial policy mentality, and an aversion to the messy and often unsightly processes of a free market and low-tech entrepreneurial activities. In this section, we focus on the fate of rural entrepreneurship in Shanghai. Rural entrepreneurship reflects the extent of urban controls. It thrives when urban controls are loose and it languishes when urban controls are tight. Shanghai is the consummate urban China in the sense that it has almost completely emaciated its rural entrepreneurship.
It should be noted that although Shanghai is widely viewed as a sophisticated, cosmopolitan metropolis, a surprisingly large number of people still work in the rural areas. By employment, in 2004, 2.48 million people out of a labor force of 8.36 million worked in the rural areas. Rural employment accounted for 29.7 percent of employment (NBS 2005a, p. 369), although many of these laborers had non-farm sources of income. Thus, rural entrepreneurship still entails significant economic implications in Shanghai even today.
We pay special attention to rural entrepreneurship in Shanghai because of our theoretical priors. We know from the early works of Schultz (1953) that urban/industrial centers exert a powerful boosting effect on the surrounding rural areas. Economic development emanates outward from the urban centers because farmers in the vicinity have greater access to industrial inputs, opportunities to improve their human capital, and non-farm business and employment opportunities. To the extent that this idea holds true in China, one would expect that, on average, rural entrepreneurs near Shanghai outperformed those in the rest of the country during the explosive growth period of the 1990s. A key unstated assumption in Professor Schultz's claim is that a market economy is in place. To the extent that his prediction is not borne out by the Shanghai data, it is a result of forces blocking the normal operations of a market economy.
We undertake two kinds of comparisons. One is to compare Shanghai with the rest of the country; the other is to compare Shanghai across different time periods. It should be stressed that all the comparisons presented in the following paragraphs are rural-to-rural comparisons; we are comparing the rural households in Shanghai with the rural households in other parts of China. We are not comparing rural Shanghai with urban China. Our sources of information are the annual rural-household surveys conducted by the NBS.
We start on the side of the production inputs – machinery and equipment in the production process – and then we proceed to look at the earnings side of rural entrepreneurship in Shanghai. We use two measures of fixed assets. The first is fixed assets used for production in all economic sectors, including agriculture. We also look at industrial fixed assets and those fixed assets deployed for the service activities. (Service industries here refer to construction, transport, warehousing/postal services, and distribution/catering services.) We single-out industrial and service fixed assets because these industries should have thrived more rapidly given their proximity to Shanghai's huge urban economy and, therefore, rural entrepreneurship in Shanghai should have reaped substantial gains from this locational advantage.
But, the data point in the opposite direction. The size of production-related fixed assets per rural household is uniformly smaller in rural Shanghai than it is in the rest of rural China. This can be shown by calculating the ratios of Shanghai to the rest of China. In 2001, the ratios are 0.53 for the fixed assets in all sectors, including agriculture; 0.27 for the fixed assets in the industrial sector; and 0.82 for the fixed assets in the services sector. The small size of industrial fixed assets in rural Shanghai is particularly noticeable. Shanghai itself is a large industrial economy, but rural households located nearby do not seem to have developed a sizable industrial operation.
Another striking observation is that the fixed-asset size of rural households in Shanghai actually became smaller relative to the rest of the country between 2001 and 2005. All three ratios are smaller in 2005 than in 2001. This reduction occurred during a period when the Shanghai economy was expanding massively. In nominal terms, the GDP of the city expanded by 1.84 times between 2001 and 2005. The real GDP growth rates were 10.5 for 2001, 11.3 for 2002, 12.3 for 2003, 14.2 for 2004, and 11.1 for 2005.
We want to highlight one finding here – that the ratios of the fixed assets in the service industries in Shanghai declined from 0.82 to 0.56 between 2001 and 2005. The service industries are normally urban-intensive; whereas urban centers may decline as manufacturing hubs, normally they should expand in these service areas. In fact, the size of the two service components of GDP – transport/warehousing/postal services, and distribution and catering services – nearly doubled in Shanghai, from 89.5 billion yuan in 2001 to 159.2 billion yuan in 2005.36 Shanghai was abundantly endowed with business opportunities in these service areas, but the benefits of these opportunities did not accrue to Shanghai's rural entrepreneurs. (Nor to the urban entrepreneurs, as we pointed out before; Shanghai's urban entrepreneurship lags behind the rest of the country.)
We now turn to the earnings side. Shanghai's rural income per capita declined relative to the rest of rural China in the 1990s. Here, we want to focus on one component of rural household income – what the NBS describes in its surveys as “household business income.” According to the NBS, household business income is derived from “rural residents using households as the production or business units” and from “production coordination and management.” The sources of the business income include agricultural production but also industry, construction, transport, distribution, and all other nonagricultural activities. Here, we want to focus on the non-farm portion of the business income, so we subtracted the agricultural income from the business income. One would expect the non-farm business income to be very high because Shanghai, as the hub of manufacturing and financial services, would normally possess abundant business opportunities.
The NBS rural household surveys provide detailed data on 1985, 1990, 1995, 2000, and 2005.37 There is a clear linear development in the business income data. The level of business income in Shanghai declined during the five points in history for which we have data. The ratio began at 1.47 in 1985 and declined to 1.15 in 1990, 0.89 in 1995, 0.57 in 2000, and 0.37 in 2005. This is a dramatic development. In China's purportedly richest region, the level of rural business income in 2005 was only 0.37 of the entire rural China. The ratio of Shanghai's non-farm business income to that of the country as a whole also declined, although less linearly as the total business income ratio. The non-farm business income ratio began at 0.60 in 1985, declined to 0.56 in 1990, and rose to 0.71 in 1995. In 2000 and 2005, the ratios were, respectively, 0.52 and 0.54. While Shanghai's GDP per capita is five multiples of the country as a whole, its non-farm business income is only half of the country as a whole. We have already seen that the returns from urban self-employment businesses in Shanghai are about the same as those in some of the poorest provinces in China. Now, we have the rural data to complete the picture: Entrepreneurship across the board – whether rural or urban – does not pay in Shanghai.
In contrast, Shanghai rural households have a very high level of wage income. Wage income is, by definition, from non-farm sources and it represents returns from labor contributions to paid employment. According to the NBS data, in 2005, the ratio of Shanghai to the country as a whole was 4.29. The wage income also accounts for a large portion of the rural household income in Shanghai. It was 71 percent in 2005, a rise from 61 percent in 1990. It is largely because of the high level of wage income that rural households in Shanghai have the highest income level in the country.
But Shanghai has always had the highest level of rural wage income in the country. This is not news. The issue here is how to assess the contributions of policy. Policies have to be assessed on the basis of their contributions to economic outcomes given the stock conditions of history. That its wage income is high in and of itself cannot be the only evidence that Shanghai has the right economic policies. Shanghai falters when we look at the relative wage income levels of Shanghai over time. In 1980, the rural wage income ratio of Shanghai to the country as a whole was 4.31. The ratio then rose to 6.25 in 1985 and peaked at 7.69 in 1990. Throughout the 1990s, the ratio declined. In 1995, it was 6.53, 4.88 in 2000, and then 4.29 in 2005. So, in 2005, whereas the average rural Shanghainese still enjoyed the highest level of wage income in the country, they were actually comparatively poorer than they were 20 years earlier. The decline in their wage income relative to the rest of the country is consistent with a whole range of economic indicators such as business income and rural household income. Shanghai still enjoyed the highest wage income in the country but its relative level compared with the rest of the country had actually declined.
In the last chapter, we saw that the greatest reversal in the 1990s involved the growth rates of rural non-farm business income, not so much the wage income received by rural households. Shanghai is not only a microcosm of this development but also an extreme version of it. Judging by the gap between the non-farm business income and GDP per capita, we can safely infer that the policy repression of entrepreneurial opportunities in rural Shanghai must have been extreme. Rural households shed considerable production assets and lost their business income, all amidst a massive building boom, rising FDI inflows, and the emergence of a manufacturing hub that is now global in scale.
3.3 For Whom Does the Door Open?
In 1991, the Shanghai municipal government issued an order – known as policy document No. 287 – banning products of private businesses from being stocked in “large and famous department stores” located on Nanjing Road and Huaihai Road (Wu Xiaobo 2006, p. 109). (Nanjing Road and Huaihai Road are the main shopping avenues in Shanghai.) Was this an aberration in a market-oriented economy? Or was it an ideological gesture that the Shanghai government felt compelled to make against private businesses in the aftermath of the Tiananmen crackdown?
The following is from a dispatch by Xinhuanet dated March 1, 2007: “In Shanghai, the most prosperous commercial economy in China, some of the commercial districts simultaneously began to show the door to domestic brands and yielded their space to international brands.”38 The dispatch makes it clear that this was a decision by the government. One stall operator, who sold cosmetic products, was informed by the state-owned department store that the criterion was not the sales revenue but the nationality of the brand. His domestic brand, he was told, had “bad genes.” Another stall operator, whose clothing line drew 40 percent of his customers, was denied an opportunity to renew his lease. He remarked, “Huaihai Road [a main shopping district in Shanghai] needs to introduce international brands and we do not even have a chance to put in a bid.” A number of documents on urban planning in the Shanghai government outlined some specific goals in terms of increasing international brands. One document envisioned increasing international brands from the current 65 percent to 70 percent in three years. Another document revealed that a government agency had conducted an examination of a store claiming to sell an international brand. The conclusion of the investigation was that it was actually a domestic brand masquerading as an international brand.
In the 1990s, the Chinese government pursued a highly biased liberalization strategy to favor FDI at the expense of indigenous private entrepreneurs (Huang 2003). Governments at both the central and local levels showered expensive policy resources to attract foreign investors while systematically restraining the business opportunities of indigenous entrepreneurs. Government officials, when pressed for an explanation, often equate their policies with the investment-promotion programs in some of the market economies. The analogy is completely false. In the market economies, the objective is to create job opportunities. In China, indigenous rural entrepreneurs laboring under onerous regulations and credit constraints have created more than 100 million jobs, whereas the highly subsidized foreign investors have created between 15 million and 20 million jobs. Also, the governments in the market economies have not differentiated businesses on the basis of nationality in the way the Chinese government has done.
Shanghai represents the ultimate embodiment of the highly biased liberalization strategy, and it may have been the pioneer of this strategy. The 1991 and 2007 rules about stock-keeping units in department stores are indicative of both the extent of the micromanagement of the Shanghai government and the overtly discriminatory nature of its regulations. The rationale provided to explain the 2007 rule is explicitly anti-market. The issue, however, is whether there is any more systematic evidence illustrating the FDI policy biases in Shanghai.
Our evidence comes from a World Bank survey conducted in 120 cities in China in 2005. The research from this survey appears in China Governance, Investment Climate, and Harmonious Society: Competitiveness Enhancements for 120 Cities in China (World Bank 2006a). As noted earlier, the World Bank, as an institution, has always been enamored of Shanghai and this report is no different. The report awards Shanghai as a silver medalist in its overall assessment of its investment climate (World Bank 2006a, pp. 46–47). The World Bank survey has three main components: (1) city characteristics, (2) government effectiveness, and (3) social measures of environmental quality, health, and education. Shanghai ranks very high in a composite ranking of these three components. Shanghai is No. 6 in investment climate for domestic firms and No. 17 in investment climate for foreign firms.
Upon closer inspection of the data, it is clear that Shanghai scores high in the stock conditions. Of the three components in the World Bank survey, two of them – city characteristics and social measures – are strongly influenced by history and by the policy treatments of the central government. On these two measures, it is not surprising that Shanghai would score very high. It has an excellent geographic position augmented by massive investments by the central government in its port facilities. It has a high level of human capital and China's best hospitals and educational institutions.
Only the measure on government effectiveness truly reflects the portion of the investment climate that is subject to the discretionary influences of local governments. This measure is based on a range of indicators, such as taxes, bureaucratic red tape, and an indicator that is widely found to be closely correlated with corruption – time spent with government officials. The findings on government effectiveness are much more meaningful in terms of both analytical and policy implications. There is very little a Chinese city located in an interior region can do about its geographical isolation, but it can improve its competitive position by strengthening its policy effectiveness.
On this measure, Shanghai has a remarkably low score. Its government effectiveness is ranked No. 77 in the country as perceived by domestic firms (in comparison with No. 6 in the overall investment ranking). Its ranking improved substantially in the perception by foreign firms, where it ranked No. 26 in the country. In other words, Shanghai is ranked in the bottom third of the Chinese cities by domestic firms whereas it is ranked in the top third of the Chinese cities by foreign firms. This is a specific illustration of the biased liberalization.
Favoring foreign capitalists is often justified by the rationale that foreign capitalists bring financial resources and technology. This reasoning lacks both conceptual and empirical support. Economic research shows that technology transfer occurs in a competitive business environment. Restricting indigenous entrepreneurs curtails competition. China, for example, attracts a huge level of FDI in sectors that have very little technological content and in sectors where indigenous entrepreneurs are expected to possess superior know-how (e.g., herbal medicine). The distortions introduced by this strategy often result in fake or round-trip FDI, as the Shanghai bureaucrats discovered when they sought to ban domestic brands. Indigenous entrepreneurs simply dressed up their products as international products to evade the regulatory restrictions. These practices have led to dishonesty in business practices on the one hand and to further bureaucratic interventions on the other.
What about the argument that FDI brings in precious foreign exchange to Shanghai? The simple fact is that the FIEs in Shanghai incur chronic deficits in their trade balances. In 2005, the FIEs based in Shanghai exported 61.6 billion dollars of goods, but they imported 63.9 billion dollars of goods, incurring a deficit of 2.3 billion dollars (NBS 2006a, p. 175). This trade imbalance persisted throughout the 1990s. Although one should not rush to the judgment that the trade imbalances of the FIEs are bad for China, or for Shanghai, it is worth noting that provinces with a more dynamic domestic private sector have positive trade balances with their FIEs, and their surpluses are huge. In Zhejiang, the FIEs had a trade surplus of 12.1 billion dollars in 2005. In Guangdong, the surplus was 30.7 billion dollars and in Fujian, it was 7.7 billion dollars. By the way, the trade surplus of the FIEs in each one of these three provinces is larger, some by several multiples, than the annual FDI inflows into Shanghai.
In 1990, Shanghai – mainly the Pudong area – was designated a special economic zone (SEZ). In the late 1970s and early 1980s, four regions of China – Shenzhen, Zhuhai, Xiamen, and Shekou – were given SEZ status. It is tempting to put Shanghai in the same category as these four SEZs in the 1980s. In fact, Shanghai is categorically different from the first-generation SEZs. One difference is that FDI liberalization in Shanghai is biased to disadvantage the domestic private sector. The success of the four SEZs in the 1980s was a product of opening both to FDI and to the domestic private sector.
We can compare the most successful SEZ in the 1980s – Shenzhen – with Shanghai. Shenzhen attracted a huge amount of FDI but it was equally successful in attracting indigenous entrepreneurial talent. In Chapter 2, using the SEBS1991 to assess entrepreneurial mobility between rural and urban areas in the 1980s, we found that a large number of self-employers with operations in urban areas were, in fact, rural residents. (SEBS1991 covered 10,000 self-employed businesses in 1991.) SEBS1991 shows that Shenzhen was far more open to rural entrepreneurs than Shanghai. In the survey, 45 percent of those self-employers in Shanghai were rural residents compared with 93 percent in Shenzhen. (In Guangdong as a whole, the ratio was 71 percent.) In the 1980s, Shenzhen implemented an internal passport system that sharply restricted migration. Despite this restriction, however, Shenzhen had a higher level of economic mobility than Shanghai.
PSS1995 – the private-sector survey of 1995 – provides another comparison between Shanghai and Shenzhen, this time of more established, larger private businesses.39 PSS1995 surveyed 83 private-sector firms in these two cities so the sample size is identical. PSS1995 shows that the employment size of private enterprises in Shenzhen was much larger than that of Shanghai (91 employees per firm in Shenzhen compared with 55 employees in Shanghai). Another indicator of the developmental level of private enterprises is the geographic scope of their operations. In the Shanghai sample, the majority of firms – 64.8 percent – sold their products locally, as compared with 35.7 percent in the Shenzhen sample. Because Shanghai's firms were immature, they were more beholden to the SOEs. In the Shanghai sample, 48.8 percent of the firms sourced products from the SOEs, compared with 28.9 percent in the Shenzhen sample.
Private entrepreneurs in Shenzhen were far better educated than those in Shanghai, suggesting that the business environment in the mid-1990s in Shenzhen was sufficiently enticing to attract quality human capital, but not in Shanghai. Among the Shenzhen entrepreneurs, 68 percent had at least an associate or college degree, compared with 24.1 percent in the Shanghai sample. Private enterprises in Shenzhen were present across all industries, whereas private enterprises in Shanghai were concentrated in a few industries. This suggests that the entry barriers for indigenous capitalists were lower in Shenzhen than they were in Shanghai.
4 Conclusion
We focus entirely on Shanghai in this chapter because of the oversized political and economic position of the city. Shanghai dominated Chinese politics throughout the 1990s (and beyond). In the late 1980s, Jiang Zemin and Zhu Rongji, both of Shanghai, assumed the two top positions of the Chinese state. Jiang was the general secretary of the Communist Party from 1989 to 2002, and Zhu was the premier from 1998 to 2003 (and executive vice premier between 1991 and 1998). Other vital national positions were held, or are still held, by men and women rooted in Shanghai. Huang Ju, the vice premier in charge of finance and a former member of the Standing Committee of the Politburo until his death in 2007; Li Rongrong, the current chairman of the State Asset Holding Commission; and Chen Zhili, who ran China's Ministry of Education, all came from technocratic backgrounds based in Shanghai.
Shanghai is a window unto China of the 1990s. The Shanghai model, formulated in the last five years of the 1980s, was a precursor to China's anti-rural bias and repression of small-scale and labor-intensive entrepreneurship in the 1990s. The economic consequences for the rest of the country were grave. As I show in the next chapter, GDP performance and personal household income began to diverge at the national level in the 1990s. The Pudong project, which in its essence is built on a massive taking of land from rural incumbents, has had a powerful demonstration effect and was widely emulated in the rest of China beginning in the late 1990s. The Pudong model contributed to rising land grabs in China as many local governments sought to create their own versions of urban miracles. The tactics include forcible evictions of long-term residents, large-scale demolitions of existing housing stock, collusions with corrupt real estate developers, and below-the-market-price land requisitions.
The political power of Shanghai underscores an essential difference between the first-generation SEZs such as Shenzhen and Shanghai. In the 1980s, Shenzhen was always on the margins of Chinese politics and was often mired in political controversy. It never enjoyed the kind of carte-blanche political power that was freely wielded by Shanghai in the 1990s. And herein is an explanation for Shanghai's outward prosperity – its rapid GDP growth, rising skyscrapers, and construction boom: It might have been heavily subsidized by the rest of the country.40 The Shanghai model is extraordinarily expensive. The Maglev train, expensive to build but very inconvenient to use, will take at least 160 years to get the investment back, according to an estimate by two economists at Hong Kong Banking Corporation (Qu Hongbin and Sophia Ma Xiaoping 2006).
That the Shanghai model is not dynamic suggests that the city might have been subsidized. More research should be done to understand how the resource transfer occurred. The potential mechanisms include fiscal transfers, financial flows through the banking system, reinvestments by SOEs controlled by the central government, and subsidized energy prices. I detail some of these developments in the next chapter, but suffice it to note here that there is a logical connection between the rural educational and health crises on the one hand and the huge urban biases in favor of cities such as Shanghai and Beijing on the other.
Herein lies the intimate connection between politics and economics. Because of its privileged position in Chinese politics in the 1990s, Shanghai was able to amass a huge amount of financial resources supplied from the rest of the country. These resources were then invested in modern infrastructures and luxury-amenity facilities and, importantly, they were used to finance very generous tax and other benefits conferred on foreign firms. It is in this sense that the Shanghai model can be described as being built on a Potemkin foundation.
Like any subsidy, someone has to finance it. The next question is, Who shouldered the financing costs of the rise of Shanghai? Deng Xiaoping is said to have famously ruminated why he had not opened up Shanghai earlier. It is not entirely clear that his remorse was justified. The SEZ designation of Shanghai was fiscally costly to the central government in a way that Shenzhen's was not. This is a second difference between Shanghai and the first-generation SEZs – the central government may have poured massive resources into Shanghai and taxed other regions of China to finance this resource transfer. In fact, one could reframe Deng's remorse as follows: The opening of Shanghai would naturally have to follow the opening of the other SEZs because the first-generation SEZs generated the resources to finance Shanghai.
I go into more details in the concluding chapter of this book, but let me mention here a few critical details. In the 1990s, as the Chinese central state was investing heavily in a few urban metropolises such as Shanghai and Beijing, the same central government under-funded rural health and education. The long-run implications of this resource allocation – investing in and supplanting the economic roles of entrepreneurs in the urban areas while taxing the rural and the poor populations heavily – are detrimental both economically and socially. From a social perspective, this policy choice planted the seeds of the jarring income inequalities and political instability. From an economic perspective, this policy choice undermined the microeconomic foundation for China's economic takeoff. I explain these views in the next chapter.
Let me end this chapter by returning to the main subject of this book – entrepreneurial development in China. The Shanghai model is not antithetical to capitalism per se; it is just antithetical to the virtuous kind of capitalism. Recall our finding that small-scale rural and urban entrepreneurship does not pay in Shanghai. Small-scale household businesses operated by people with humble backgrounds languished in the 1990s. In their stead, there emerged a small coterie of politically connected crony capitalists who thrived in Shanghai's distorted business environment. Shanghai is the quintessential state-led capitalism as described by Baumo, Litan, and Shramm (2007).
In 2003, the All-China Federation of Industry and Commerce (CFIC) published a list of the 1,582 largest indigenous private-sector firms in China. Of the top 100 firms ranked by sales on the CFIC list, six were based in Shanghai. This compares with 35 based in Zhejiang and 17 based in Jiangsu, the two provinces bordering with Shanghai. To put Shanghai's ranking in perspective, on this list there were the same number of firms from Liaoning, a province in China's northeast that was saddled with inefficient SOEs and with a struggling economy in the 1990s. The six Shanghai firms were not ranked particularly high on the list. The top Shanghai firm is Shanghai Fuxing (No. 6 on the list); the five other Shanghai firms were ranked Nos. 15, 39, 60, 81, and 91, respectively. Another statistic is also telling. Of the six Shanghai firms, three were connected to real estate and construction, the most political sector in the Chinese economy.
A few private-sector firms in Shanghai did attain some fame. One is the Fuxi Investment Group founded by Zhang Rongkun, a private entrepreneur from Suzhou in nearby Jiangsu. Zhang was known in Shanghai as the “road king” because his firm successfully gained management rights over a number of critical highways around Shanghai. For a firm that was founded only in 2002, the rise was meteoric. In 2002, the same year of its founding, his firm spent 3.2 billion yuan ($400 million) to acquire the management rights for a Shanghai highway. This was followed by another massive acquisition in 2003, to the tune of 5 billion yuan ($600 million), and a 2004 acquisition of 588 million yuan ($70 million). By 2005, Zhang's firm had obtained the control rights of 200 kilometers of highways in Shanghai. Forbes magazine ranked him as the 16th wealthiest individual in China in 2005.
The Chinese media described Mr. Zhang as highly secretive and shy of publicity. So, little was known about him until July 2006 when publicity was forced on him – he was arrested.41 It turns out that Mr. Zhang rose in the same way that the Russian oligarchs rose in the 1990s – through audacious corruption deals. It was revealed in the media that 30 percent of the investment capital that Mr. Zhang amassed came from Shanghai's pension fund, and the remainder came from bank loans and under-the-table privatization deals involving one of the largest SOEs in the city, Shanghai Electric. In other words, Mr. Zhang never built or developed a true business. He became big because of his political connections.
The cast of characters involved in this scandal reveals the depth of the crony capitalism in Shanghai. The head of the pension fund, which incurred a massive deficit of 4 billion yuan in 2002, was arrested, as was a secretary to the Party secretary of Shanghai. And, finally in September 2006, Chen Liangyu, the Party secretary of Shanghai, whose quote appeared before in this chapter, was detained on corruption charges. At the time of this writing (August 2007), the Chen Liangyu affair is still producing ramifications. The secretary to a prominent member of the Shanghai faction and former member of the Politburo's Standing Committee, Huang Ju was arrested in July 2007.
Incidentally, many foreign investors and observers would describe Shanghai as quite clean. They seem to know the trees of petit corruption but miss the forest of grand theft. Since late 2006, eight senior officials in charge of land management have been arrested.42 One official, with a nickname “King of Land” because every deal had to go through him, was found to have received 4 million yuan in bribes. Another official, a deputy director of land management bureau, amassed 10 million yuan, about $1.25 million in his bank accounts, and 26 apartments valued between 70 million and 80 million yuan (between $8.7 million and $10 million), all on the strength of his 10,000-yuan civil-servant pay scale. Liu Jinbao, the head of the Shanghai branch of the Bank of China in the 1990s, reportedly took bribes amounting to 30 million dollars (“Bank Executive Arrested over $30 Million Fraud Scandal” 2004).
Probably the most notorious corruption case in Shanghai concerns that of Mr. Zhou Zhengyi, a real estate tycoon. Prompted by a lawsuit filed by a group of Shanghai residents whom Zhou had evicted with the help of the Shanghai government, Zhou was arrested but was given what was widely considered an extraordinarily light sentence – three years in jail – on stock-market fraud. This is not all. The Shanghai authorities arrested and sentenced the lawyer – Mr. Zheng Enchong, who led the lawsuit against Zhou – to the same jail sentence (three years) as the one given to Mr. Zhou. This is crony capitalism at its very worst.
The ascendancy of crony capitalism is a fitting testimonial to the Shanghai model and to the industrial policy approach of the 1990s. Shanghai represents the political triumph of the Latin American path, anchored on the prominence of statist interventions, huge urban biases, and distorted liberalization in favor of FDI at the expense of indigenous entrepreneurship. Shanghai, as the world's most successful Potemkin metropolis, is both the sign of and the culprit for what is structurally ailing in the Chinese economy today. If the Chinese economy stumbles, future historians will look back at the dizzying rise of skyscrapers from the rice paddies of Pudong as a glaring warning sign that almost everyone missed.
APPENDIX
A.1 Statistical Findings on Entrepreneurial Underdevelopment in Shanghai
The findings presented in the text that private-sector firms are very small in Shanghai are based on a descriptive reading of the survey data. One might object that these findings do not sufficiently control for factors that might account for some of the differences between Shanghai and other regions. Yi Qian and I have conducted a detailed statistical analysis of both survey and industrial-firm census data (Huang and Qian 2008), and the results are consistent with the descriptive analysis presented in the text. After controlling for many firm-level attributes and detailed industry characteristics, Shanghai private-sector firms are fewer in number and are far smaller in employment, sales, and assets as compared with almost all the provinces and cities in China.
A.2 Did Shanghai Get a Rotten Deal?
There is a long-standing view that Shanghai got a historically “rotten deal” from the central government – that Shanghai paid heavily into the treasury of the central government. In 1985, Shanghai's tax collection as a ratio of its fiscal expenditure was about 4:1; in Guangdong, it was about 1:1. The difference was remitted to the central government.43 But, the fiscal channel is only one of many ways in which the central government can transfer resources. Although the central government taxed Shanghai heavily, it also invested heavily in Shanghai in the 1980s and the 1990s. In 1986, Shanghai's GDP was about two thirds that of Guangdong (41 billion yuan compared with 62 billion yuan), but from 1986 to 1990, the central government invested 63 percent more in Shanghai than it did in Guangdong.44 In the first half of the 1990s, the central government continued to invest more in Shanghai compared with Guangdong, despite the fact that the economy of Shanghai was smaller.
Another reason why the “rotten-deal” view is misleading is its implicit suggestion that Shanghai was somewhat unusual. In fact, it is Guangdong that was unusual, not Shanghai. Many other provinces bore a heavy tax obligation toward the central government, and some of these provinces still managed to create a dynamic entrepreneurial sector. Take Zhejiang as an example. In 1985, Zhejiang collected 5.83 billion yuan in tax revenue but only expended 3.74 billion yuan. The difference was remitted to the central government. To be sure, the difference between tax collection and expenditure is much greater in the case of Shanghai than in the case of Zhejiang. The ratio of tax to expenditure in 1985 was about 4 in Shanghai but 1.56 in Zhejiang. This is a large gap, but it shrank rapidly between 1985 and 1990 – 2.25 in Shanghai and 1.26 in Zhejiang – and, in fact, since 1995, Shanghai has been a net recipient of tax revenue from the rest of the country in the sense that it spent more than it collected. There is no evidence that entrepreneurship in Shanghai failed to take off because of the high taxes by the central government.
The central government favored Shanghai in another way as well – it restricted the access of other regions to some of the FDI opportunities. In 1992, the central government issued the first insurance license to the American International Group to sell life-insurance products only in Shanghai. No other cities were allowed a similar right despite the fact that in the 1980s, foreign insurance firms had already established representatives in a number of cities other than Shanghai. In 1997, the Chinese central bank granted licenses to eight foreign banks to conduct renminbi business in the Pudong district. The number of foreign banks subsequently increased to 24 by March 2000 (Lardy 2002).