
5. Capitalism with Chinese Characteristics - Capitalism with Chinese Characteristics: Entrepreneurship and the State
By Yasheng Huang
Chapter 5: Capitalism with Chinese Characteristics
One day in August 2006, Mr. Cui Yingjie, a small-time street peddler, suddenly lunged toward a market regulator in the Beijing municipal government and knifed him to death. Mr. Cui had lacked a business license to operate his stall and the market regulator had confiscated his three-wheeled dolly – worth about US$50. This was the trigger to this tragic event.1
Media reports of clashes between stall operators and market regulators are increasing in frequency. In one report, market regulators in Qingdao city were fitted with bullet-proof vests and helmets as protection against rebelling private merchants. On March 20, 2006, according to a Hong Kong newspaper, thousands of traders in Dongguan, a city in Guangdong province, clashed violently with the police. The protest was triggered when the market regulators beat and inflicted severe injuries on an unlicensed trader. The riot lasted for 12 hours and hundreds of police officers eventually prevailed by using tear gas to disperse the crowd. According to the Hong Kong newspaper, this was the third large-scale riot in the city of Dongguan in 2006 (and the article was published in March).
We have seen this type of violent clashes between government regulators and small traders before but not usually in an economy widely viewed as dynamic, rapidly growing, and liberalizing. The Stanford economist, John McMillan, in his book Reinventing the Bazaar: A Natural History of Markets (2002), describes how in 1979 the military government of Ghana resorted to violence and brutality to shut down the Makola marketplace in the city of Accra.2 The soldiers, armed with machine guns, beat up the traders and looted their stalls. In one case, a soldier “ripped [a trader's] baby off her back and shot her.” They also dynamited and bulldozed the entire marketplace. The military government accused these small traders of price gouging and placed the blame for its own poor economic performance – high inflation – on them.
In China, the repression of the small entrepreneurial traders was not motivated to eliminate them but rather to extract rent from them. This hypothesis is consistent with the fact that licensing fees were rising in the 1990s and local government regulators were acting with increasing ferocity to root out unlicensed traders. In the 1980s, unlicensed traders were merely fined, and thus they were allowed to continue to operate. But by the 1990s, market regulators were seeking to incapacitate the unlicensed traders. Their tactics included confiscating their equipment, destroying the commodities, and even inflicting physical injury. The pecuniary interests to the bureaucrats must have been massive as judged by the determination of their efforts – such as equipping with bullet-proof vests – and by the willingness to incur the huge political and social costs of their actions.
Probably the best illustration of the rent extraction occurred in Xiushui Market in Beijing.3 Xiushui Market was a thriving outdoor market fair, located not far from the US Embassy. It started spontaneously in 1985 when a few traders began to sell fruits and vegetables. (The folk wisdom in Beijing holds that Xiushui Market created the first generation of millionaires in Beijing.) By 2004, it was one of the most successful retail operations in the city. Xiushui Market, specializing in fake brand-name goods, was extremely popular with foreign tourists. With a huge volume of business, it was nicknamed “Little Hong Kong” or “Little Paris.” According to one estimate, it was doing US$12 million in sales annually; on weekdays, the market would attract 10,000 visitors a day and up to 20,000 visitors a day on weekends.
Xiushui Market became a valuable brand name, with the full value accruing to the traders operating there, almost all of whom had set up their shops in the 1980s and who single-handedly had contributed to the value of the Xiushui brand. Then, the bureaucrats moved in to capture the handsome rent embodied in the brand. The specific details are lacking but we know the broad contours of the story. In 2004, Chaoyang district government, where Xiushui Market is located, decided to close the entire outdoor market to build a nearby indoor market. They gave two rationales. One was that Xiushui Market posed a fire hazard; the other was that Xiushui Market was illegally selling fake products. Although Xiushui Market never had a documented case of fire, this rationale at least was theoretically plausible. The marketplace was narrow and crowded, but it is not clear that closing down the entire market was the only way to minimize the fire hazard. The second rationale was patently false. One week into the opening of the new Xiushui Market, journalists spotted numerous pirated goods on display.
The true reason was probably rent extraction. In China's real estate market, the buy-and-sell sides of a transaction are governed by diametrically opposite rules. On the buy side, the government, acting as the monopsonist, does not permit competition. No bids are held and all transactions are carried out in top secrecy. On the sell side, the government, now the monopolist, maximizes competition by organizing bids and auctioneering. This deal is similar. Without any bidding, Chaoyang district government awarded the right to build and operate the new Xiushui Market to a private entrepreneur who did not have a stall in the old market. Not a single detail of this deal was disclosed. Even a promised public hearing on the demolition of the old Xiushui Market – not on the right to operate the new market – was apparently never held.
Without any input from those merchants who actually created the value of the Xiushui brand and without any explanation on the choice of the entrepreneur to build the new market, Chaoyang district government arbitrarily assigned control of this very valuable asset to an outsider. There is another irregularity here. Under Chinese law, all land belongs to the state. So, Chaoyang district was the landlord of the original Xiushui Market. One can think of a public policy rationale to strengthen public finance by charging high rents to the Xiushui merchants and to benefit from the government's nominal ownership of the Xiushui brand. But this is not what happened. The government transferred the windfall gains to a private entrepreneur. A postulation that the deal at least was tainted with shadiness is not farfetched.
In January 2005, the government demolished the old Xiushui Market. The police were there to suppress a last-ditch, desperate protest by the stallholders. The private entrepreneur awarded with the right to operate the new market then auctioned off the new stalls competitively. The highest bid fetched 4 million yuan (US$480,000). Because of the high bids, only one third of the original Xiushui merchants were able to set up operations in the new marketplace. In essence, the original Xiushui merchants were paying the market price for the right to the brand they themselves had created. For the other merchants who failed to win a bid, the brand was completely expropriated from them.
Xiushui Market is not alone. Another is the closing of Xiaoyang Lu Market in Shanghai in 2006. The official rationale is again grand – rooting out pirated goods from Shanghai. Xiaoyang Lu Market, like Xiushui, specialized in fake products. (In fact, Xiaoyang Lu Market was known as Shanghai's Xiushui.) But, as the reporter for Economist Intelligence Unit discovered, the real reason was property sales. Shanghai government, as soon as it closed down the Xiaoyang Lu Market, leased the plot to Sun Hung Kai group from Hong Kong for a substantial amount of money. According to this report, the authorities told the merchants to sell their pirated ware elsewhere (Washburn 2006). We do not know if this land deal was tainted with corruption; all we know is that eight senior officials who presided over Shanghai's real estate have been arrested for corruption since late 2006.
The fate of Xiushui Market is a microcosm of the evolution of Chinese capitalism during the last 30 years. The most laissez-faire phase was in the 1980s when the market, founded with little bureaucratic interference, developed and expanded spontaneously. The new Xiushui Market carries all the elements of the Chinese economy today. For sure, it is not socialism; Chaoyang district government awarded management rights to a private entrepreneur rather than retaining management itself. So China is capitalistic, as I point out in the first chapter of this book, but it is capitalistic in a particular way. It is crony capitalism built on systemic corruption and raw political power. Property rights are not secure. A politically connected entrepreneur, with the full backing of the coercive power of the state, could simply expropriate the value of the Xiushui brand from hundreds of entrepreneurs who had created the brand. This business environment is especially detrimental to small-scale entrepreneurs. Two thirds of the poorer original Xiushui merchants lost absolutely. They could not even enjoy the future gains from the Xiushui brand.
We saw in Chapter 2 that many of the first-generation rural entrepreneurs came from humble backgrounds. Mr. Nian, the poor farmer in Anhui province, was able to enter the retail market of Shanghai, Beijing, and Dalian. Mr. Cui, the unlicensed peddler who committed a capital crime, came from a similarly humble background. He was a retired soldier unable to find a job in his native province so he eked out a meager living by baking sausages. Although Mr. Nian thrived in the 1980s, under the grabbing hand of the state today, millions of poor people like Mr. Cui are now denied a similar opportunity. There has been a sharp decline in self-employment businesses since the late 1990s. In 1999, the number of self-employment businesses in the urban areas stood at 31.6 million, but in 2004, it had declined dramatically to 23.5 million, all during a period of a seemingly urban boom. The reason was the rising and exorbitant fees levied on such self-employment businesses. The situation improved slightly in 2006. As of June 2006, the number of urban self-employment businesses was 25.1 million.4
The fate of Mr. Cui and millions like him is pregnant with significant implications. In this final chapter, I delve into some of them. Although not all of these implications have been rigorously tested and empirically examined, they are natural inferences based on the findings in this book. As such, they should be viewed as conjectures that call for future debate and exchange of ideas. I take stock of the finding that the evolution of capitalism during the last 30 years has been highly heterogeneous. In their book, Good Capitalism, Bad Capitalism, Baumol, Litan, and Schramm (2007) offer a taxonomy of different capitalist systems in the world. There is state-guided capitalism, in which government sets industrial policies and directs investments. Then, there is oligarchic capitalism that empowers and enriches the few at the expense of the many. The third variety is big-firm capitalism that accentuates the dominance of big firms and suppresses innovation. The last category, which the three economists argue is the only sustained path to economic prosperity, is entrepreneurial capitalism in which small and innovative businesses drive growth.
This taxonomy of capitalism offers a productive way to examine the evolution of capitalism in China during the last 30 years. In the 1980s, China moved fast and far toward entrepreneurial capitalism in its vast countryside. In the 1990s, this development was reversed and China today resembles the state-led capitalism prevailing in Latin America. The most important question is, “Did it matter for China that the government reversed the directional liberalism of the 1980s?” The consensus view among China economists is that reforms continued and deepened in the 1990s. The most tangible support for this consensus view is that GDP continued to expand. It is legitimate to ask about both the evidence for the policy reversals as well as the evidence of the effects of the policy reversals. In the previous chapters, I presented the evidence on policy reversals; here, let me offer evidence on the effects of the policy reversals.
The ultimate criterion to assess the quality of an economic system is whether it is conducive to the improvement of human welfare. The most powerful intellectual justification for China's partial reforms is that they have produced a Pareto-optimal outcome. This is the idea behind a 2000 paper that claims that the Chinese reforms have produced all winners and no losers (Lau, Qian, and Roland 2000). Published in one of the most prestigious economics journals, Journal of Political Economy, the paper assumes that Chinese reforms always improved rural welfare and that the reforms were a homogeneous process. In 2000, our systematic knowledge of the state of rural China during the 1990s was partial and incomplete. (There was no shortage of anecdotal reports of dire situations in rural China, however.) With more data, we can now revisit the claim that the Chinese reforms produced no losers.
The first section of this chapter assesses the welfare impact of the policy reversals in the 1990s. Probably the most tangible evidence of the adverse effects of the policies of the 1990s is the sharp rise in illiteracy in China, all of which most likely took place in rural China. Between 2000 and 2005, the number of illiterate adult Chinese rose from 85.07 million to 113.9 million. I provide more details on this grave development later in the chapter, but it is important to note here that the way adult illiteracy is measured in China implies that all the newly illiterate Chinese between 2000 and 2005 were the products of the country's basic education system in the 1990s. There is a near-perfect match in terms of timing between the policy turns toward urban biases, financing constraints in rural China, and constrictions of rural entrepreneurship on the one hand and the deterioration of educational performance on the other. Although we have less direct evidence on the state of health in rural China, available evidence suggests that the state of health care deteriorated in rural China as well.
I look into the issue that GDP grew as rapidly in the 1990s as it did in the 1980s. Measured in terms of the growth of GDP per capita, the difference between the entrepreneurial decade of the 1980s and the state-led decade of the 1990s is minuscule. However, Shanghai provides an important clue – the fast GDP growth did not necessarily translate into fast growth of personal income. I show that in the 1990s, relative to the fast pace of GDP performance, the growth of personal incomes lagged significantly. This lag was in sharp contrast to the pattern in the 1980s when the growth of personal incomes exceeded the growth of GDP. The divergence is descriptively consistent with a host of other indicators that raise questions about the economic and social performance in the 1990s, including the rising illiteracy and the rapid escalation of income inequalities.
One of the strengths of China is its geographic heterogeneity. Although the country as a whole moved toward a statist version of capitalism in the 1990s, some regions continued with the economic model of the 1980s. One of the most famous and most successful regions is Zhejiang province. In the second section of this chapter, I argue that this is “the other path” for China and that the Zhejiang model is closer to the entrepreneurial capitalism based on rural entrepreneurship and small-business dynamism. To sharpen the contrast, I provide the example of another development model – this one adopted in the neighboring province of Jiangsu. Jiangsu, although similar to Zhejiang on many dimensions, was more state-led but has been outperformed by Zhejiang across the board.
Within China, even some of the most ardent supporters of the Chinese approach – such as economist Wu Jinglian – have come around to the view that without deep political reforms, reforms of economic institutions cannot succeed (Pei 2006). This is a full circle back to a position embraced by Zhao Ziyang as early as 1987, when he made political reforms a central component of his policy agenda. However, a widespread view among Western analysts is that a sharp tradeoff exists between democracy and economic growth. Normatively, some believe that democracy is a luxury good, which a poor country like China cannot afford. Positively, democracy is viewed as a constraint on economic growth. It slows down decision making when decisiveness is most needed to jump-start economic development.5
Increasingly, this view that poor countries are faced with a Faustian political and economic choice is being contradicted by the very country that supposedly supplied the clearest evidence in favor of this hypothesis – India. India has begun its own economic takeoff as its GDP has grown above 8 percent for a number of years. Skeptics may point out that India also registered episodic high growth rates in the 1970s and 1980s but its growth faltered in subsequent years. In this book, I advocate an “Indian model” on the basis of the belief that the current round of high growth will be sustained. In the 1970s and 1980s, the Indian economy was primarily agriculture-based, which means that its growth at that time was very sensitive to the vicissitudes of weather. (India has the added disadvantage of being located in a tropical zone with unpredictable weather conditions.) This time around, India's growth is broad-based – in services, in manufacturing, and even in agriculture. The lesson from this emerging economic miracle is that “soft infrastructures,” such as financial and legal institutions, are more important than hard infrastructures for economic growth. In the second section of the chapter, I present a stylized comparison of China and India.
The third section of the chapter returns to the big question that started this book – the nature of Chinese capitalism today. Chapter 1 presents data showing that the size of China's indigenous private sector is very small even after 30 years of economic reforms. I put this finding against a broader, international perspective. My argument is that the best way to characterize the Chinese economic system today is that it is a commanding-heights economy. This system has many failed antecedents among the statist developing economies of the 1970s. Many view the Chinese economy as another East Asian economy. I dispute this perspective and show that the East Asian economies, notwithstanding the high levels of industrial policy interventions, were far more privately owned than China is today. Commanding-heights economies are typically corrupt because they place enormous power in the hands of the government. Capitalism with Chinese characteristics is also deeply corrupt. I discuss some of the manifestations of the corruption problem in China and the phenomenon of land grabs that poses a systemic threat to China's political and social stability as well as to its economic prospects.
Lastly, I try to assess the prospects for the Chinese economy going forward in the next five to ten years. Here, the most alarming sign is a virtual collapse or stagnation of productivity growth in the Chinese economy since the late 1990s. The country today is still saddled with considerable problems in its financial system, a weak social foundation, and a corporate sector divided between the highly profitable state monopolies and private-sector businesses operating on the margins of technology and innovations. On a more hopeful note, the current Chinese leaders, Hu Jintao and Wen Jiabao, have pursued a different policy agenda from the leadership of the 1990s. They have put the rural issues again on the forefront of the policy agenda and have revived some of the rural financial reforms of the 1980s. Rural income has registered its fastest rate of growth since the late 1980s, as we saw in Panel (2) of Figure 4.1 in Chapter 4. In many ways, the Hu–Wen leadership is seeking a return to the directional liberalism of the 1980s.
There are, however, significant risks ahead. One risk is expectational – that people expect governance to improve when objective conditions for an improvement do not exist. This may happen when a more liberal political rhetoric raises expectations of the public but fails to change the behavior of the Chinese bureaucrats. There are also economic risks, including the challenge of managing asset bubbles inflations, and rising cost pressures. In the final section of this chapter, I speculate about some of these risk factors and assess the likely trajectory of the Chinese economy during the next critical period.
1 Does It Matter?
In the introductory chapter, I quote a number of highly positive views of China's economic performance by Nobel laureates. Such sentiments are widespread. Many regularly tout those indicators of a rising China: its massive foreign exchange reserves, its huge economic size as measured in purchasing power parity (PPP) terms, and its voracious appetite for raw materials and energy that power economic growth from Latin America to Africa. Books with titles such as The Chinese Century, One Billion Customers, and The Rise of China convey the impression of a rising economic superpower. The World Bank, an ardent fan of China, recently elevated China from a “lower income” to a “lower middle income” country.
On the surface, it does not seem to matter whether Chinese capitalism is entrepreneurial or state-led. In both the 1980s and 1990s, China's GDP grew rapidly. As of August 2007, the Shanghai stock market index, hovering around only 1,000 points as recently as 2005, reached above 6,000 points. The real estate market was booming. The 2008 Olympics fed a feverish investment boom across the country. Amidst these signs of prosperity, it is fair to ask, “Does it really matter whether Chinese capitalism is entrepreneurial or state-led ?”
I show that it matters along three dimensions. First, I present new evidence that social opportunities – arrangements for health care and education – contracted during the fast GDP growth period of the 1990s. Recently available data show that illiteracy in China has risen sharply, and this increase is due to the poor performance of basic education in rural China in the 1990s. Rising illiteracy is probably the most monumental legacy of the policy model of the 1990s.
I single-out developments in health care and education for emphasis because they are considered fundamental components of human welfare. Many countries, including China, have enacted explicit guarantees for equal and universal access to health care and education. Health care and education are enshrined as human rights in the Chinese Constitution and they hold both intrinsic as well as instrumental values. The welfare gains from rising life expectancy and improved health are just as important as the welfare gains from income growth. They are also critical inputs to economic growth. China's own achievements in the social arena in the 1960s and 1970s are widely credited as important reasons behind its economic takeoff during the reform era.
Recall the finding in Chapter 4 that GDP per capita and personal income per capita in Shanghai have negative correlations with one another, whereas the two are positively correlated in Zhejiang. This finding shows one substantial implication of state-led capitalism vis-à-vis entrepreneurial capitalism – there is a difference in the welfare of the Chinese people under the two systems. This is the second topic of this section. GDP, along with personal income, grows rapidly under entrepreneurial capitalism. Under state-led capitalism, GDP may still grow very fast but personal income lags. Although a firm conclusion awaits more research, preliminary analysis shows that as a ratio of GDP per capita, personal income declined sharply in the 1990s as compared with the 1980s. Related to the welfare implications of entrepreneurial vis-à-vis state-led capitalism is an issue of who gained the most from the rapid GDP growth. Shanghai again offers a clue – it has a very unequal income distribution. In the 1990s, China's social performance deteriorated substantially. This is the third topic of this section.
1.1 Social Opportunities
In their book, India: Economic Development and Social Opportunity, Jean Drèze and Amartya Sen (1999) highlight a critical reason why India lagged behind China in the initial phase of economic development – India's highly inadequate and inequitable provisions of health care and educational facilities. The “social backwardness” of India prevented broad and effective participation in economic and political activities even when the opportunities for such participation presented themselves (as when the country moved toward a market economy and was a democracy). Later in this chapter, I come back to this theme in the China–India comparison and argue that the different levels of social opportunities, not FDI or infrastructure, are the central reasons behind the performance differences between the two countries.
For now, let me focus on the state of social opportunities in China. Social opportunities – defined as the arrangements a society makes for education and health care – interact with economic growth both as a precondition and as an outcome. It is well established that the initial endowment of human capital matters substantially for economic growth. The experience of China amply confirms this relationship. As I show in Chapter 2, micro data show that the first generation of Chinese entrepreneurs was quite well educated, confirming the idea of Drèze and Sen that health and education “prepare” a population for economic participation.
Initial conditions aside, economic growth can, in turn, exert an effect on social opportunities. Sen (1999, p. 45) presents a sharp contrast between two types of high-growth economies. In one, as exemplified by South Korea and Taiwan, high economic growth was accompanied by an expansion of social opportunities. In the other – for example, Brazil – GDP per capita experienced fast growth but without the comparable success in raising the levels of education and basic health care. Clearly, economic growth itself does not automatically expand social opportunities. The income growth of the poor, rather than the average income growth, and specific policy interventions such as public expenditures earmarked for education and health are more important than the simple GDP growth itself.6
We know that average GDP growth in China has been very rapid. The next question to consider is whether China falls into the category of South Korea and Taiwan or into the category of Brazil. Did social opportunities expand during the reform era? In terms of our demarcation of the two decades, which phase of Chinese capitalism expanded social opportunities more? These are deeply complex questions that require a more systematic treatment than I can provide here. My purpose is to suggest some clues for further discussion and research.
I focus the discussion on the rural population. It is reasonable to assume that the welfare of the rural people is more sensitive to the social arrangements regarding the financing and provision of health and education. In the rural areas, people are poorer and are more vulnerable, and the points of service provisions are more geographically dispersed than in the urban areas. So, the rural population already faces some extra difficulties in accessing health and education facilities regardless of the specific designs of the social arrangements. A theme running through this book is that rural China is particularly entrepreneurial. Thus, expansions or constrictions of social opportunities in the rural areas may have a disproportionate effect on the overall level of entrepreneurship in the society.
China is widely recognized – and admired – for having successfully educated a broad segment of the population, especially in the rural areas, during the 1960s and 1970s (Sen 1999, p. 42). Although studies on China's educational performance since 1978 identify concerns and challenges, the consensus view is that China has made steady strides in basic education during the reform era as well. A 1999 World Bank report is confident that China has successfully achieved the goal of universal nine-year compulsory basic education. The World Bank team recommends that China move to a system of 12 years of compulsory education, comparable to OECD standards (World Bank 1999).7
Much of this positive appraisal of China's educational performance is based on official data on enrollment and attainment, which clearly demonstrate substantial progress. The net enrollment ratio is nearly 100 percent at the basic education level and educational attainments at the upper levels of basic education – junior and senior secondary education – and at the tertiary levels were all increasing steadily.
Details matter. Local governments in China often automatically register school-age children as enrolled in schools. But we know very little about the actual attendance of these enrolled students, especially in the rural areas. It is almost certain that local officials falsified their educational data. Exaggerating GDP growth may lead to greater demands from higher levels to ratchet up tax collection, to which local officials are averse. There is no similar self-constraint in reporting false educational data. Chinese educational researchers and journalists have documented blatant cases of statistical falsifications. The most extreme case I have come across occurred in Wei county of Hebei province.8 In 2000, the county government certified that schools in the region had successfully met all of the targets of “nine-year compulsory education.” One of the targets was to achieve a dropout ratio below 3 percent. But, in 2003, a journalist discovered that only 3,000 students took the graduation examination in the junior secondary schools of Wei county. The class of 2003 had started in 2000 with 10,000 students. Thus, the cumulative three-year dropout ratio was 70 percent. In 2005, things “improved” a bit: 4,000 out of 10,000 students remained to take the graduation examination.
The attainment data overstate China's educational achievements. The data include partial attainment – attendance of a level of schooling, not graduation – as sufficient to be included in the category of educational attainment.9 The Chinese definition of a given level of schooling specifically and explicitly includes dropouts from that level of schooling. The following is the definition of high school attainment given by the NBS in its household income surveys (NBS 2006b, p. 327): “Referring to the highest educational attainment at the high school level, including those who graduated from, attended in the past (yiye in Chinese), or are currently attending high schools.” The definition also includes high school equivalents. The same methodology applies to all levels of schooling. Primary school attainment also includes those who never attended primary school but who are considered literate under the Chinese definition (discussed later).
Chinese data on literacy between 1990 and 2000 show a steep decline in adult illiteracy, from 180 million in 1990 (15.9 percent of the adult population) to 85.07 million (6.72 percent) in 2000. An adult is defined as someone at or above 15 years of age. The Chinese definition of literacy is the ability to identify 1,500 Chinese characters. Normally, a Chinese student attains this ability between the third and fourth grades – by the age of 7 to 9.
Given the way that adult literacy is measured, there is a six- to eight-year lag between the performance of China's basic education and its adult literacy data. A person reaching the age of 15 between 1990 and 2000 would have attained the Chinese standard of literacy before the early 1990s. The declining illiteracy between 1990 and 2000 primarily reflects the quality and performance of China's basic education up to the early 1990s. To know how Chinese basic education has functioned since then, we need the literacy data after 2005.
On April 2, 2007, China Daily, the official English-language newspaper, reported that the number of illiterate adult Chinese increased by 30 million between 2000 and 2005 (Wang Zhuoqiong 2007).10 This implies that in 2005 there were 115.7 million illiterate adult Chinese. (In 2000, there were 85.07 million.) The China Statistical Yearbook 2006 reports a slightly lower figure – in 2005, the number of adult illiterate Chinese was 113.9 million (NBS 2006c, p. 114).11 Illiteracy not only increased in absolute terms but also in relative terms. The illiteracy rate of the adult population increased from 6.72 percent in 2000 to 11.04 percent in 2005, an increase of 64.3 percent. (To ensure that the definition of literacy has not changed, I checked the current definition of illiteracy and found that there is no change in the definition.)12
Prior to 2000, we have illiteracy data for 1964, 1982, and 1990 (NBS 2006c, p. 102). The number of illiterate adult Chinese totaled 233.3 million (33.6 percent of the adult population) in 1964, 230 million in 1982 (22.8 percent), 180 million in 1990 (15.9 percent), and 85.07 million in 2000 (6.72 percent). We do not have data for the intervening years, but it is safe to assume that Chinese illiteracy – measured both in absolute and relative terms – continuously declined up to 2000. The abruptness and the scale of the reversal are probably unprecedented in history anywhere else in the world.
Assuming the same rate of depreciation of human capital in China since 2000 as before 2000, then it must be true that all of this increase in illiteracy was due to new adults becoming illiterate, rather than due to relapses (i.e., previously literate adults losing literacy). Those reaching the age of 15 between 2000 and 2005 were born between 1985 and 1990, and all of their primary school education occurred in the 1990s. The rise in illiteracy was thus completely a product of Chinese education in that decade.
The timing coincides precisely with the period of urban biases and rural deprivations as depicted in this book. Because of the sheer size of the rural population and because of the greater sensitivity on the part of the rural population to the costs of education, rural basic education drives the Chinese data on illiteracy. Assuming all of the newly illiterate adults to be rural Chinese would imply that China's basic education failed 33 percent of the rural cohort between 10 and 14 years of age as of 2000. (In 2000, according to the population census, the number of rural Chinese in the 10 to 14 age cohort was 89.5 million.)
As I maintain throughout this book, the best way to understand China in the 1990s is to explicitly benchmark it against the decade of the 1980s. Consider the following fact: In the early 1980s, the enrollment rate initially dropped and by a substantial margin. Pepper (1990, p. 79) documents that the number of students enrolled in primary schools declined from 150 million in 1975–1976 to 140 million in 1982. Hannum, Behrman, and Wang (2008) report that the drop in the enrollment rate among secondary-school age men in rural areas was especially dramatic during the early 1980s. Yet, illiteracy data between 1990 and 2000 show a sharp drop, from 180 million to 85.07 million. (Most of those reaching the age of 15 between 1990 and 2000 received their primary education in the 1980s.)
It is important to understand what triggered this initial drop in the enrollment ratio in the 1980s as a contrast with the development in the 1990s. In the early 1980s, the rural reforms improved the income-earning prospects of farmers, thus leading to a shift in labor allocation away from education in favor of more remunerative activities. This dynamic explains in particular the sharp drop in male enrollments in secondary school. In other words, the decline in the enrollment rate in the early 1980s was due to the rising opportunity costs of education. But the rising opportunity costs were not a binding constraint on education. The main effect was a delay in education rather than forgoing education altogether, especially forgoing basic education. This is consistent with the fact that the gross enrollment ratio – the number of students enrolled at a given level of schooling divided by the number of people in that age group – bounced back very strongly in the mid-1980s.
This is the critical difference with the 1990s. In the 1990s, the actual costs of education rose substantially. High actual costs of education are prohibitive (absent of financing intermediation, which rural China does not have) and they force those who cannot afford it to forgo education altogether. The following is my hypothesis of what happened. In the 1990s, there were two developments on the financing side of Chinese education. First, there was a withdrawal of public funding for education, including basic education. Second, the costs of education were rising rapidly. The combination of these two developments led to high nonattendance in primary schools and, in all likelihood, contributed to the educational failures in rural China, the evidence of which is becoming available only now.
Public expenditure on education in China was never high to start with and it became even lower over the course of the 1990s. In 1998, public expenditure on education was 2.2 percent of GDP; in 1988, the ratio was 2.6 percent. At 2.2 percent of GDP, China spent less on education compared with India (3.2 percent), Brazil (4.9 percent), and Bangladesh (2.4 percent). In the group of countries selected by Hannum, Behrman, and Wang (2008) for comparison, China only spent more on education than Indonesia (1.5 percent of GDP) and Pakistan (1.8 percent of GDP). Moreover, in the 1990s, China spent almost all of its central-government education budget – 94 percent – on tertiary education, leaving the bulk of the financing responsibilities for basic education to the local governments (Pei 2006, p. 171). And, as is well known, local governments in the 1990s ran on a growing fiscal shortfall becuase the 1994 tax reforms recentralized revenue collection in the hands of the central government.
The declining public investments in education meant rising private financial burdens. A Chinese scholarly estimate suggests that the private share of the financing costs for primary school education as of the turn of the century accounted for 76 percent (quoted by Pei 2006, p. 172). We go to the NBS rural household survey data to look into the question of the rising costs of education. The rural household income surveys provide a category of “expenditures on culture and education.” This category includes expenditures on tuition and textbooks, as well as newspaper subscriptions, tickets to cultural events, and so forth. The bulk of this category of rural expenditures is probably on education.
Figure 5.1 shows per capita cultural and educational expenditures by rural households as ratios to per capita consumption expenditures between 1980 and 2005. The expenditures are valued on a cash basis so the data exclude in-kind expenditures.13 In the early 1980s, there was a sharp decline in the ratio, from 9.6 percent in 1980 to 3.8 percent in 1983, and then the ratio began to rise in 1984. It reached a peak in 2003 with a ratio of 14.9 percent. Recall the earlier discussion that school enrollments dropped in the early 1980s because of the rising opportunity costs of education. The decline in the ratio captures this effect when rural households reduced their educational expenditures as fewer rural children attended school. Consistent with the story that school enrollments began to rise in the mid-1980s, educational expenditure ratios began to rise as well.

Figure 5.1. Health care and education expenditures as percentage shares of consumption expenditures of rural households, 1980–2005 (%). Note: Education expenditures also include cultural and entertainment expenditures. All the expenditure figures here exclude expenditures in kind and refer to cash expenditures only. Source: Rural household surveys by NBS, various years.
Both cost increases and rising enrollments can lead to a rising ratio. Because we do not have data on education costs, we can only make some educated estimates. I adopt the following estimation procedure. First, I estimate an expenditure ratio at which a full enrollment is attained. Then, I attribute the spending in excess of this ratio to rising costs rather than to rising enrollments.
It is reasonable to estimate the full-enrollment expenditure ratio at 10 percent. From Figure 5.1, rural households spent 9.6 percent of their expenditures on culture and education in 1980 and about 10 percent in 1992. In those two years, China had more or less full enrollment at the level of basic education. In 2003, this ratio reached 15 percent, a 50 percent increase from 1992. Although a part of this increase was due to the expansion of more costly senior secondary and tertiary education, this is a smaller part of the picture. The ratio of rural residents attending school beyond junior secondary education was fairly low. Because the official data for basic education show consistent full enrollments throughout the 1990s, a reasonable hypothesis is that the rising costs of basic education reduced school attendance, about which there is no systematic data. To make sense of the illiteracy data from 2000 to 2005, one has to assume that enrollment and attendance diverged sharply in the 1990s (or the enrollment data were falsified).
A 2005 academic study, commissioned by the Ministry of Education and authored by 17 prominent educational researchers in China, uncovered widespread nonattendance at schools.14 Based on field research covering 17 rural junior secondary schools located in 14 provinces during the 2001–2003 period, the average dropout rate among the 17 rural junior secondary schools was 43 percent. The highest documented dropout rate was 74.34 percent. The transition rate in the urban areas – that is, the percentage of students transitioning from junior to senior secondary schools – increased from 40 percent in 1985 to 55.4 percent in 1999. However, this transition rate in the rural areas declined from 22.3 to 18.6 percent during the same period.
In Chapter 3, we saw that the decadal shift in economic policies brought about an instantaneous slowdown in rural income growth. We are now beginning to see the staggering costs in human capital terms. Furthermore, the future prospects are grim. The urban biases began in the early 1990s, rapidly accelerated in strength in the mid-1990s, and probably peaked in 2002–2003. As of 2005, Chinese researchers were still reporting high dropout and nonattendance rates in the rural areas. The Hu–Wen leadership began to address this problem in 2004 with a policy initiative to waive tuition and other charges for rural Chinese by 2007. Even if their policy initiatives are successful, they only address the flow problem – reducing the rate at which China is producing illiteracy. Unless drastic action is taken, the stock problem – the legacy from the 1990s – will continue to plague the country for years to come.
In the area of health care, we do not have one clean data point – such as rising illiteracy – that sharply differentiates between the two decades, but we have multiple suggestive indicators that point to a deterioration in the 1990s. It is well established that during the reform era (i.e., in both the 1980s and 1990s), public financing of health care collapsed. In the 1970s, the community medical scheme (CMS) covered 90 percent of the rural population; by 2003, it covered only 20 percent of the rural population (World Bank 2005b).15 The 2003 outbreak of Severe Acute Respiratory Syndrome (SARS) was a wakeup call and exposed the fragility of China's health system. SARS was confined to the urban areas, which have good health facilities. Had SARS spread to rural China, the consequences would have been much more severe. The new leadership of Hu Jintao and Wen Jiabao has taken public health more seriously and has rolled out a pilot insurance program in 300 counties (there are more than 2,500 counties in total). The commitment is to cover the entire rural population by 2010.16
An emerging body of evidence shows that the policy neglect of health care, stretching over the entire reform era, has begun to affect the health status of the Chinese population. Systematic research shows that Chinese health care performance has deteriorated both against its own past achievements and against expectations (conditional on past achievements and the values of those variables predictive of health care performance). The World Bank researchers show that in the 1960s and 1970s, China was able to reduce its under-5 mortality by 6 percent annually, but the rate of reduction began to decline in the 1980s and the speed of the fall accelerated in the 1990s. In the 1980s, the rate of reduction was 3 percent and in the 1990s it was 2 percent. In the 1960s and 1970s, China was out-performing Indonesia and Malaysia by a substantial margin in reducing child mortality under the age of 5. In the 1980s, China began under-performing against Malaysia; then, in the 1990s, it was under-performing both Malaysia and Indonesia. Because the under-5 mortality reduction is a function of both the past level of mortality and per capita income, the World Bank researchers have also calculated the predicted rates of reduction for China. It is the same picture. In the 1960s and 1970s, China out-performed relative to its predicted rates of reduction. In the 1980s and 1990s, China under-performed relative to its predicted rates of reduction (and in the 1990s by a substantial margin).
Rather remarkably, given the supposed economic miracle in the 1990s, China is one of very few countries in the world that has a higher infant mortality rate for girls than for boys. In the 1990s, the mortality rate for boys under the age of 5 declined by 2.3 percent a year on average, but the mortality rate for girls under the age of 5 rose by 0.5 percent a year. The World Bank report does not go into detail to explain these differential effects, but one fact identified by the report is that China was charging for immunizations in the 1990s. An explanation could be that the rising immunization costs have forced rural households to choose between boys and girls in allocating the shots. The same report concludes that “China is off-track for the majority of the health MDGs [Millennium Development Goals], and this is largely due to shortcomings in its health system” (World Bank 2005a).
Is there also a tale of two decades here – that the development in the health care sector was more adverse in the 1990s than in the 1980s? Although the policy neglect of health care, especially in the rural areas, was present during both the 1980s and 1990s, there are some substantial differences. One difference is that at least by the indicators presented herein, Chinese performance relative to international norms worsened at a faster rate in the 1990s than in the 1980s. The second difference is that the absence of any health insurance program in the 1990s was a purer case of policy neglect. One can plausibly argue that the initial collapse of the rural CMS was to a large extent inevitable. The CMS was intrinsically part and parcel of the massively inefficient commune system. The hugely welfare-improving collapse of the commune system was inevitably accompanied by a collapse of its embedded components, even though some of these embedded components served useful functions.
One can come up with a number of explanations that put the policy inaction in the 1980s in some perspective – such as the brevity of the time to deal with this issue, the recognition of which began around 1984; lack of knowledge; and the stringency of public finance.17 But none of these explanations can be applied to the 1990s. The leaders of the 1990s had 13 years at their disposal, had presided over a steady rise in the tax/GDP ratio, and had ample access to information and knowledge about both the dire situation in rural China and the experiences of other countries in creating and managing social protection institutions during their period of rapid economic growth. There is no excuse for this level and duration of willful neglect of such a massive problem.
There is yet another difference between the 1980s and the 1990s. In the 1980s, although the burden of financing was shifted from the community to individuals or households, the Chinese state was not profiting from the provision of health care. In the 1990s, the government-run hospitals and their doctors began to increase charges for hospitalization and outpatient visits and for prescription drugs. According to a group of Chinese experts on public health, between 1992 and 2002, GDP per capita grew by 50 percent in real terms but per capita spending on hospital/clinic visits and on hospitalizations increased 2.15 and 3.76 times, respectively (Du Lexun, Zhang Wenming, and Zhang Dawei 2004). In the 1990s, China experienced an extraordinarily fast rate of inflation in the health care sector.
Figure 5.1 presents per capita expenditures on health care as percentage ratios of per capita consumption expenditures between 1980 and 2005 in rural China (on a cash basis). In the 1980s, the health care expenditure ratios were fairly flat, remaining very close to 4 percent. The turning point, yet again, was 1989. In 1988, the ratio was 4 percent; in 1989, it shot up to 4.3 percent and then sharply to 5.3 percent in 1990. Between 1992 and 1997, the ratio fluctuated around 5.5 percent and then in 1998 it began a linear climb, reaching 6 percent in 1998, 7.1 percent in 2001, and 7.9 percent in 2005. This is the social version of the economic tale of the two decades. In the 1980s, the social insurance system collapsed due to the rural reforms, but health care costs were more or less contained. During the next 10 years, between 1988 and 1998, however, the ratio increased by 50 percent and then another 30 percent between 1998 and 2005. The 2005 ratio is almost twice as high as that in 1988.
Although Chinese rural residents spent twice as much in 2005 on health care as they did in 1988, there is no evidence that the quality and quantity of health care have improved. According to the 1998 National Health Service survey conducted by the Ministry of Health, 37 percent of rural residents who were sick did not seek medical care due to the unaffordability of health care. In the same survey, 65 percent of those who should have been hospitalized were not because they could not afford it. Both of these figures were significantly higher than those in 1993, suggesting that health care became less available over time. China is ranked by the World Health Organization as one of the most inequitable countries in the world in terms of the distribution of and access to health care. By the measure of “fairness in financial contributions,” China was ranked No. 188 in 2000, ahead only of Brazil (189), Myanmar (190), and Sierra Leone (191).18
Objective data bear out this picture. Although on the supply side China looks impressive in terms of the number of doctors or hospitals per population,19 the prohibitive costs of medical facilities may have deterred their usage. Medical and health facilities, however abundantly available physically, do not improve health if they are not used. Chinese data show a sharp difference in the utilization rate of hospital beds between the 1980s and the 1990s.20 In the 1980s, the utilization rate was increasing. In 1985, the rate was 82.7 percent, in 1987 84.3 percent, and in 1988 84.5 percent. The latter – 84.5 percent in 1988 – turned out to be the peak. Beginning in 1989, the utilization rate of hospital beds began to decline. In 1989, it was 81.7 percent, in 1992 78.6 percent, in 1996 64.7 percent, and in 2002 57.4 percent. Interestingly, 57.4 percent in 2002 – the last year of Jiang Zemin's rule – marks the trough of this measure. Starting in 2003, the rate began to rise. In 2003, it was 58.7 percent, in 2004 61.3 percent, and in 2005 62.9 percent. Again, as in so many other areas, the improvement coincided with the commencement of the leadership of Hu Jintao and Wen Jiabao.
1.2 Welfare and GDP Growth
Economics, John Stuart Mill famously stated, is the study of “the sources and conditions of wealth and material prosperity for aggregate bodies of human beings.” “Aggregate” is the key operating word here because it gets to the heart of why economic growth matters. Economic growth matters because growth improves the welfare of the majority of the population. It is not sufficient that growth benefits only a few elitist members of the society. Throughout this book, I have stressed the point that economic growth under the entrepreneurial capitalism in the 1980s was broad-based, whereas the growth under the state-led capitalism in the 1990s was not.
Economists and other analysts rely almost exclusively on Chinese GDP data to formulate their views of the Chinese economy. GDP data are readily available and are assembled on the basis of standardized and systematic procedures. The assumption is that the Chinese GDP correlates closely with the “wealth and material prosperity for aggregate bodies of human beings.” In this book, I raise the issue of whether this assumption is warranted. I propose a conjecture – not a settled claim – that Chinese GDP diverged from Chinese welfare in the 1990s.
I focus on two issues concerning Chinese GDP data.21 One has to do with the construction of the deflators used by statisticians to calculate real GDP growth. This is related to the aforementioned cost inflation in health care and education in the 1990s. The second issue has to do with the observation first made by Khan and Riskin (1998) that personal income per capita – obtained through household surveys – grew much more slowly than GDP per capita. Khan and Riskin drew their findings from the two waves of the China Household Income Project (CHIP) surveys of 1988 and 1995. According to them, the weighted rural and urban income per capita grew at 5.05 percent a year in real terms between 1988 and 1995, compared with an annual average rate of 8.07 percent of per capita GNP growth. Because the CHIP surveys do not go back far enough, Khan and Riskin cannot examine whether GDP and income survey data diverged in the 1980s as well. We go to the NBS household survey data that go back to the early 1980s to find the following pattern in the data: In the 1980s, personal income grew faster than GDP, but in the 1990s, it was the other way around. The direction of the divergence differs systematically between the two decades.
One way that the Chinese deflators can be under-estimated is that the weight assigned to rural spending on health care and education may be too low in the construction of the Chinese consumer price index (CPI).22 This is a hypothesis that requires more research, but we have some suggestive clues. As postulated before, the huge rise in adult illiteracy between 2000 and 2005 must imply large-scale nonattendance of – or dropout from – schools in the 1990s, to the tune of roughly 30 percent of rural school-age children. We also know from the 1998 National Health Service survey that 37 percent of rural residents were not treated when sick because of the high health care costs. By definition, the expenditure ratios shown in Figure 5.1 do not reflect the forgone expenditures by those who failed to attend schools or by those who did not seek medical care. The reported educational and health expenditures thus understate the welfare impact of cost inflation in health and education.
One can correct the Chinese CPI by assigning a weight to education and health care based on full schooling and full access to medical care. After all, this is what is guaranteed in the Chinese Constitution, so education and health care should be treated as entitlements rather than as normal goods and services. The adjusted CPI will thus exceed the official statistics. Health care and education experienced the fastest price increases in the 1990s. I have already pointed out the high inflation in health care. In education, according to Holz (2005), in the early 1990s, the growth in the cost of tuition and child care exceeded the CPI by about 10 percent. This divergence grew extremely large toward the late 1990s. In the late 1990s, China experienced a general deflation, but the costs of tuition and child care continued to rise. By 2000, the growth of tuition and child care costs exceeded the CPI by some 30 percent. Assigning a greater weight to the highest-inflation items would lead to a higher estimate of the CPI.
The under-statement of the Chinese deflators is not a narrow – and narrowly technical – issue. It has massive implications for gauging the true growth rates of Chinese GDP. The under-estimations of the CPI would naturally overstate Chinese GDP growth. This is another way of stating that the official data on GDP growth do not fully reflect the welfare gains and losses of the Chinese population. This analysis also shows that Chinese GDP growth rates are highly sensitive to the choice of deflators. As an illustration, in the following paragraphs, I present several estimates of growth rates based on different deflators. The idea here is not to argue that one set of deflators is superior to another set of deflators. Rather, the point is to illustrate a systematic difference in the pattern of growth rates between the 1980s and the 1990s.
Table 5.1 presents two groups of indicators: the real growth rates of per capita GDP and the real growth of per capita household income. There are three time periods – 1979–1988, 1989–2002, and 2003–2005 – coinciding with the tenure of the three generations of leaders during the reform era. The growth rates of GDP per capita are derived in two ways. One is that we use the official implicit GDP deflators to deflate the published nominal GDP numbers. These are the official GDP growth rates. The second method is to deflate the nominal GDP with the deflators that Chinese statisticians use when they report the real growth rates of household income. The household income deflators capture the price developments of those goods and services most pertinent to the well-being of the Chinese population.
Table 5.1. Per capita GDP and weighted rural/urban income: Real annual average growth (%)

Notes: The NBS publishes the nominal values of GDP and household income as well as their real growth rates. The implicit deflators are then derived accordingly. The weighted rural–urban incomes are derived by using the rural–urban population shares.
Source: Statistical Yearbooks, various years, and rural and urban household surveys, various years.
For now, I concentrate on the 1980s and 1990s. I come back to the period since 2002 later in this chapter when I assess the leadership of Hu Jintao and Wen Jiabao. Panel (1) of the table presents the growth rates of the GDP per capita as the annual averages during the three policy periods. Row (1a) uses the implicit GDP deflators and Row (1b) uses the implicit household income deflators. (The NBS publishes both the nominal values and their real growth rates. The implicit deflators are derived accordingly.) The growth rates based on the official implicit GDP deflators, which are the widely cited figures, show only a slight difference between the two policy periods under the first two generations of Chinese leaders. Between 1979 and 1988, GDP per capita grew at 8.5 percent per year, compared with 8.1 percent during the 1989–2002 period.
The performance difference becomes more apparent once we use an alternative set of deflators based on the household income surveys, as shown in Row (1b). By this measure, GDP per capita grew at 9.5 percent a year between 1979 and 1988, compared with only 6.9 percent during the 1989–2002 period. The difference becomes substantially larger in terms of the per capita household income measure, as shown in Panel (2). During the 1979–1988 period, the population-weighted household income per capita grew at 11.1 percent; over the subsequent 13 years, growth fell sharply, to only 6.3 percent during the 1989–2002 period. (The weights used in the calculation refer to the rural and urban population shares.) The rural income growth, as I point out in Chapter 3, contracted sharply between 1989 and 2002. Urban China did much better during the 1989–2002 period. Per capita urban household income grew substantially faster in the 1990s compared with the 1980s as well as compared with rural China.23
Our third indicator is the ratio of the weighted rural-urban household income per capita to GDP per capita. In Chapter 4 of this book, we saw that there is a large gap between household income and GDP in Shanghai, whereas in Zhejiang, the gap is smaller. Shanghai's GDP per capita is roughly 5 times the national average, whereas its per capita household income is only 1.7 times the national average. There is a similar difference in the national data between the decades of the 1980s and the 1990s, as shown in Panel (3). During the 1979–1988 period, the ratio of the weighted rural–urban household income to GDP per capita was 56.2 percent; this ratio fell substantially to 48.7 percent during the 1989–2002 period.24
More – and more systematic – research is needed to further explore the following conjecture: The divergence between welfare and GDP grew in the 1990s. The GDP data do not sufficiently differentiate the vast differences between the 1980s and the 1990s, but those measures bearing more closely on the welfare of the Chinese people do show rather substantial differences. Economic policies affect not only GDP growth but also how GDP growth does or does not improve welfare or to what degree it improves welfare. One piece of evidence apparent in Table 5.1 is that since 2002, GDP growth and personal income growth again began to converge. I discuss the details later but again, this development took place under the leadership of Hu Jintao and Wen Jiabao, who, as is widely known, began to put more emphasis on improving the living standards of the Chinese people rather than on GDP growth per se.
That there can be a divergence between GDP growth and welfare gains is a cautionary tale to those economic observers who formulate their grandiose views of the Chinese economy on the basis of GDP data alone. It is for this reason that this book treats GDP performance as the beginning of the analysis rather than as the end of the analysis. In Chapter 1, I cite research that contrives analytical devices to comport manifestly inefficient institutions and policies on the one hand with the excellent GDP performance on the other. Maybe a simpler and a more analytically productive approach ought to have been to probe more deeply into the complications and implications of GDP performance.
1.3 Equity
It is well established that China today is among the most unequal societies in the world. According to Khan and Riskin (2005), China had a Gini coefficient (which measures inequality of income distribution) of 45 in 2002, compared with 31.6 in Korea (1998), 32.5 in India (late 1990s), and 34.3 in Indonesia (2002). By 2006, China's Gini coefficient reached 49.6, according to a report by the Chinese Academy of Social Sciences based on a survey of 7,140 households (Dyer 2006). China has now surpassed or is in the process of surpassing the level in Latin America, the region widely known as having the worst income inequality in the world (and troubling economic performance). According to the data provided by Khan and Riskin (2005), the Gini coefficient was 46.5 in Costa Rica, 52.2 in Argentina, 57.1 in Chile, and 58.5 in Brazil.
A part of this increase in the dispersion of income distribution is not surprising. To be sure, the income distribution during the socialist period was compressed, but the price for this was an extraordinarily high level of poverty. One mechanism to achieve absolute egalitarianism under central planning was the complete suppression of incentives in resource allocation. Moving away from the absolute egalitarianism of the central planning era and toward a greater reliance on economic incentives is likely to lead to an expansion of income gaps among individuals endowed with different dispositions and capabilities. From an efficiency perspective, income disparities rise for “good” reasons.
There can also be an entirely different reason for rising income disparities. In this case, certain groups or individuals are privileged – by the political process, financial system, and regulations – over others to grab a larger share of the economic gains. For example, the privileged groups or individuals can enter into businesses that are off-limits to others; under this scenario, the income disparities rise because the economic processes are anti-competitive. A more subtle form of anti-competitive economic processes is the restrictions not on the economic opportunities per se but on the social opportunities – the acquisition of psychological inclinations and educational and physical capabilities to participate in economic opportunities. In this case, economic opportunities may be distributed equally, but the social opportunities to participate in them are not. Income disparities can rise as a result and for “bad” reasons.
But here is the analytical challenge: The “good” and “bad” mechanisms for income disparities lead to an observationally identical result – a rising Gini. We do not know which set of factors is behind the rising income disparities or which set of factors is more important. Both for analysis and for drawing the right policy implications, it is critical to identify the true mechanisms – economic incentives or blockage of economic opportunities – behind China's rising income disparities during the reform era. Let me suggest a way to think about this issue.
A simple, although crude, way to distinguish between the economic incentive story and the anti-competitive story is to assume that 100 percent of the income disparity in the United States is the result of market incentives. Under this assumption, the Gini coefficient of the United States can serve as an upper threshold between the “good” and the “bad” mechanisms for income disparity. It is an upper threshold because in the United States, racial discrimination and the political power of big business can also be construed as obstructions to economic opportunities. For our purposes, it is better to err on the side of caution against drawing a false positive and, therefore, it makes sense to set a high threshold on the basis of the US level rather than on the basis of the more egalitarian East Asian level.
Estimates of Gini coefficients often vary by sources and by analysts. For the sake of simplicity, I adopt the estimates provided in Khan and Riskin (2005) who directly compared the Gini coefficient for China with that of other countries, including the United States. According to them, the recent Gini coefficient for the United States is 40.8. If this is the threshold, China crossed it sometime in the early 1990s. China's Gini was 38.2 in 1988 and 45.2 in 1995 (Khan and Riskin 1998). In 1980, China's Gini was 28 (Khan and Riskin 2001). Based on these numbers, we can argue that in the 1980s, the rise in the Gini was due to the workings of the economic incentives, whereas in the 1990s, it was due to the blockage of economic opportunities.
One supporting piece of evidence for this hypothesis comes from Khan and Riskin (2005). According to their analysis, both urban and rural entrepreneurship – defined as self-employment businesses – improved income distribution, although each in different ways. Rural entrepreneurship was found to increase within-rural income inequality but it decreased rural-urban income inequality. Their analysis shows that within-rural inequality contributed very little to China's overall income inequality, whereas rural–urban income differences had a huge effect. Thus, the net effect of rural entrepreneurship was an equalization of income. Urban entrepreneurship, on the other hand, improved within-urban income distribution because small-scale self-employers in the urban areas tend to be poor. An extension of this finding to the theme of this book leads to the conclusion that in the 1990s, blockage of business opportunities for small-scale entrepreneurs exacerbated income inequalities. This dynamic also explains the income distribution pattern in Shanghai. Shanghai is the extreme version of the policy model that restricted small entrepreneurs, with grave implications for income distribution.
There are other telltale signs that in the 1990s the rising Gini was a result of factors other than economic incentives. The economic incentive story is most compatible with rising income disparities at the individual level – such as educated individuals earning more than uneducated individuals – rather than at the group level, especially groups of individuals with incidental characteristics (e.g., place of birth or race). The following is one of the most unusual findings by scholars who have looked at income distribution in China in some detail: In the 1990s, there was a sharp decline in individual income inequality and there was a sharp rise in group income inequality, primarily in the rural vis-à-vis the urban groups. This is from Khan and Riskin (2005), who report that both the rural Gini and the urban Gini declined between 1995 and 2002, whereas rural–urban income disparities rose sharply. This is true whether or not migration is taken into account.
Another intriguing finding is that factors such as place of residence, in fact, increased in importance in explaining income distribution. This is reported by Sicular et al. (2007). They show that the variables at the individual or household levels, such as the size of household, education, and age, explain about 54 percent of urban–rural income differences in 1995 but only about 20 percent in 2002. That is, in 2002, 80 percent of the income differences are a result of incidental factors such as the geographic residence of the households, compared with only 46 percent in 1995. This finding is rather remarkable considering the following. One is that their paper implicitly already incorporates the story of economic incentives by including education and other variables. So, another reading of their finding is that the importance of economic incentives declined between 1995 and 2002. The other factor is that between 1995 and 2002, China was supposed to have experienced an increase in the regional mobility of labor as rural migrants moved more freely between rural and urban areas. The rising importance of geographic factors in their econometric exercise is quite unexpected given this increase in labor mobility.25 Although the scholars who have generated these findings do not explicitly make this argument, I would argue that these findings are largely consistent with the story of blocked opportunities rather than with the story of rising economic incentives.
Our third clue comes from the rising social tensions in Chinese society. Although few China economists take the sharp increase in social unrest in China as a data point in their perspectives on China (in sharp contrast to other China social scientists), these incidences of social unrest help to put the rising Gini in perspective. In general, economists are less concerned about the relative deprivation – rising incomes of all groups in the society but at different rates – than about the absolute deprivation (some groups losing income relative to the levels of their past incomes). If the rising Gini is a result of relative deprivation, the implications are relatively benign. If, however, the rising Gini is a result of absolute deprivation, it is altogether a different story.
The rising levels and the degree of severity associated with social unrest in China suggest the looming possibility of absolute deprivation. In the post-Tiananmen political environment in China, social unrest – demonstrations, protests, riots, strikes, and so forth – are highly risky undertakings. The individuals involved face realistic and swift prospects of arrest and severe punishment. It is unlikely that millions of Chinese participated in these highly risky activities simply because of relative income differences. A hypothesis centered on absolute deprivation seems to be more appropriate to the phenomenon in question.
Protests in China increased at a stunning rate. Between 1993 and 1997, the total number of demonstrations rose from 8,700 to 32,000.26 According to official figures released by the Ministry of Public Security, there were 58,000 large-scale incidents of unrest in 2003, 74,000 in 2004, and 87,000 in 2005. In an ominous development, in September 2007, more than 2,000 demobilized soldiers rioted simultaneously in two cities 770 miles apart from each other, indicating a high level of coordination. The ex-soldiers were protesting their poor living conditions (“Thousands of Ex-Soldiers Riot in China” 2007). Another group of statistics is even more startling. According to Professor Li Shuguang, a vice dean at the graduate school at Chinese University of Politics and Law, in 2005 the central government received 30 million petitions from Chinese citizens addressing various grievances. Professor Li also reveals that between 1979 and 1982, the Chinese government received only 20,000 similar petitions annually (Chen 2006). Professor Li is in a position to know. His university is closely associated with the Ministry of Public Security, which handles petitions.
We already have some preliminary evidence of the absolute deprivation in China. In Chapter 4, we saw that the poorest 10 percent of Shanghai's population lost income every year since 2001. It turns out that this was a development at the national level as well. During the period when GDP growth averaged more than 10 percent, a World Bank study reports that the income of China's poorest 10 percent of the population declined by 2.4 percent every year between 2001 and 2003 (McGregor 2006b). This is the first documented evidence that a large number of Chinese people – 130 million people – have actually experienced an absolute reduction in their living standards. That this absolute deprivation occurred at a time of double-digit GDP growth is a worrisome sign that Chinese growth has taken on an inherently anti-poor bias.
2 The Other Path
The title of this section is taken from the seminal book by Hernando de Soto. Hernando de Soto (1989), a Peruvian economist, documents the barriers to indigenous, small-scale entrepreneurs in his native country of Peru. In a real social science experiment, de Soto assembled a research team to follow all the required bureaucratic procedures to set up a one-employee garment factory. The process took the team members 289 days and cost them a total of $1,231, equivalent to three years of an average Peruvian income. Hernando de Soto shows the massive, self-inflicted harm to a poor struggling economy because of policies repressing indigenous entrepreneurship.
The ideas of de Soto gained wide acceptance and acclaim among policy makers and academics around the world – until China came along. In his book, The End of Poverty, Jeffrey Sachs (2006), an influential development economist, questions the basic premise in de Soto's work. China's growth experience figures heavily in Sachs’s critique. He argues that economic growth is not a single-factor process and many factors other than the security of private property rights and the policy treatment of private-sector firms contribute to growth. China's growth, Sachs argues, did not depend first on “solving the deeds and titles.”
Sachs does not recognize the distinction I make in Chapter 1 between the personal security of a proprietor and the security of her property. Sachs is right that China did not first solve “the deeds and titles” and then grow its economy. But China did solve the personal security of millions of those holding deeds and titles as a first order of policy business. China was moving directionally toward liberalism and, by the “nasty, brutal, and short” standard of the Cultural Revolution, did so by leaps and bounds. The incentive effect was massive.
An empirically accurate framing of the China story is entirely consistent with the essence of de Soto's claim – the most important contributory factor to broad-based economic growth is indigenous entrepreneurship. Among Chinese policy makers as well as among Western observers in the 1990s, there was an obsession with the supposed growth-boosting effects of foreign direct investment (FDI). (Incidentally, just at the time when de Soto's experiment encountered numerous difficulties in registering an indigenous firm in Peru, the country, under President Fernando Belaunde from 1980 to 1985, enthusiastically wooed FDI by tax and policy concessions.27) The leaders of Shanghai routinely highlighted the number of Fortune 500 MNCs making investments in the city, not the growth of household income, as their achievement. For many years, Western analysts habitually wrote off the economic prospects of India simply because that country was unable to attract FDI.
My argument that the decade of the 1980s was the true China miracle implicitly assigns zero weight to FDI in explaining China's economic takeoff. In the 1980s, very little FDI flowed into China. Let me make this view explicit here. I do it in two ways. First, I compare Zhejiang with Jiangsu. I have referenced Zhejiang several times in this book as the most successful entrepreneurial economy in China. There is another aspect to the Zhejiang story – it has attracted very little FDI. Jiangsu, a neighboring province, has exactly the opposite combination. Like Shanghai, Jiangsu has systematically repressed indigenous entrepreneurship with its left hand while lavishly courting foreign investors with its right hand. (The direction of the hand analogy is intentional.) Here is a contrast between the two provinces: Zhejiang has outperformed Jiangsu in every meaningful dimension of economic performance. I present more details on this in the following section.
I then present a stylized comparison between China and India. There are both positive and normative aspects to this comparison. On the positive side, the stellar performance of the Indian economy should debunk many myths about growth – the outsized role of FDI being one of them. On the normative side, the rise of India undermines, hopefully fatally, the intellectual underpinnings of an idea that, in fact, never had any empirical support in the first place – that democracy is anti-growth. As China ponders the question of whether to begin to reform its politics, a closer look at India's experience is highly relevant.
2.1 The Zhejiang Model
All our indicators are better than those of Ningbo [in Zhejiang province], except per capita income.
– Wang Mang, the mayor of Suzhou of Jiangsu province, 2004
In this quote, Mayor Wang of Suzhou city of Jiangsu province gets right to the essence of our tale of two provinces. Compared with Zhejiang, Jiangsu has everything on its side – FDI, high-tech industrial parks (with heavy support from another FDI-heavy economy, Singapore), bank loans, and massive investments – except for one thing that actually matters, economic performance. Mayor Wang cites the GDP per capita data. In doing so, he is understating the true differentials between the two provinces. The relative difference between Zhejiang and Jiangsu – the ratio of Zhejiang to Jiangsu – in terms of GDP per capita was 1.11 in 2006 (NBS 2007a, p. 71). But the gap was much larger in terms of per capita household income, a better measure of the material well-being of the average person. In terms of urban household income per capita, the relative difference is 1.30 and in terms of rural household income per capita, the relative difference is 1.26. The gap is even larger when measured by specific components of household income. Consistent with the idea that an entrepreneurial economy is better at wealth creation, an average urban resident in Zhejiang earned an asset income 3.4 times that of her counterpart in Jiangsu province.
These differences are not mere statistical abstractions. They have real welfare implications. In 1990, an average resident in these two provinces had a roughly identical life expectancy at birth: 71.37 years in Jiangsu and 71.78 years in Zhejiang. In 2000, the gap increased: 73.91 years in Jiangsu and 74.70 years in Zhejiang. There are other objective differences. An average rural resident in Zhejiang consumes and owns more telephones, computers, color TV sets, and cameras than her counterpart in Jiangsu. She also lives in a bigger house.28
That Zhejiang's life expectancy surpassed that of Jiangsu is an extremely important data point: Zhejiang is a catch-up story. Today, Zhejiang is the richest province in terms of per capita GDP and per capita household income. (In this and the following comparisons, I exclude Beijing, Shanghai, and Tianjin because these three metropolitan areas do not have an agricultural sector.) To put it simply, Zhejiang is rich because it has grown faster. Jiangsu is also among the richest provinces in China today, but it is rich because it has always been rich. In 1980, Zhejiang was ranked No. 7 in the country in terms of per capita GDP, compared with Jiangsu's No. 3 position. Today, Zhejiang has the highest per capita GDP (minus Beijing, Shanghai, and Tianjin), whereas Jiangsu retains its No. 3 ranking. In 1980, Zhejiang and Jiangsu had the same level of rural household per capita income. By 1990, the Zhejiang/Jiangsu ratio was 1.15 and by 2006, it rose to 1.26 (NBS 2007a, p. 368). There are other performance differences as well. Jiangsu was more indebted, had much higher investment/GDP ratios, and a higher non-performing loan ratio. Thus, Jiangsu carries some of the same traits of China as a whole – it has grown very fast but it requires massive resources to power its growth.
A comparison of these two provinces is a near-perfect natural experiment. Their geographic conditions are almost identical. Located next to each other, both are coastal. Jiangsu is to the north and Zhejiang is to the south of Shanghai. The two provinces are also similar in terms of their history of entrepreneurial development. In 1952, private firms accounted for 57 percent of the sales value in the retail sector in Jiangsu and 60 percent in Zhejiang.29 At the beginning of the reforms, the size of the industrial non-state sector was quite similar as well. Historically speaking, these two provinces were among the most entrepreneurial and culturally developed in China. In the first half of the 20th century, both supplied industrialists and entrepreneurs to Shanghai, and throughout Chinese history, the two provinces produced some of the most prominent literary and political figures.30
The two provinces differed in two critical aspects. First, Zhejiang relied substantially less on FDI for its economic performance as compared with Jiangsu. In the second half of the 1980s, both provinces drew very little FDI, as measured by the proportion of FDI to total fixed-asset investments. In Jiangsu, the ratio was only 0.63 percent, about the same as the ratio in Zhejiang (0.65 percent). In the first half of the 1990s, as China became more open to FDI, this ratio rose in both provinces but much more rapidly in Jiangsu. On average, FDI accounted for 13.6 percent of fixed-asset investments in Jiangsu, which was more than twice the level in Zhejiang during the same period (5.7 percent). Other measures, such as output and export shares by FIEs, indicate the same contrast.
The second difference is that Zhejiang was a vibrant entrepreneurial economy, whereas Jiangsu was a more statist economy.31 Jiangsu and Zhejiang represent two contrasting development models in China, a phenomenon first noted in 1986 by Professor Fei Xiaotong, China's most prominent sociologist. The Wenzhou model is characterized by a heavy reliance on private initiatives, a noninterventionist government style in the management of firms, and a supportive credit policy stance toward private firms. (Wenzhou is a city in southern Zhejiang province, hence the name of the model.) The foundation of the Wenzhou model was established in the 1980s, as a 1990 World Bank TVE study notes. Byrd and Lin (1990, p. 34) characterize the Wenzhou model as follows:
The famous “Wenzhou” model is characterized by free development of private enterprises (mostly household undertakings), a thriving financial market based to a large extent on private financial institutions, and extensive commercial relationships with distant parts of China.
In sharp contrast, the “Sunan model,” which prevailed in Jiangsu, was highly interventionist and discriminatory against indigenous private entrepreneurship. In Jiangsu, private enterprises “are tolerated, but their development has been constrained by limits on loans, restricted access to inputs, and environmental and other regulations” (Svejnar and Woo 1990, p. 80). The Sunan model also carried a strong industrial policy approach with a heavy emphasis on the role of the government, rather than the private sector, in economic development. The model emerged in the 1980s and persisted until the late 1990s. (Since the late 1990s, the province has partially moved away from this model of economic development by privatization of the collective TVEs and more financial support for the private sector.)
The level of micromanagement in the Sunan model was extensive. Wuxi, a city in Jiangsu, is widely regarded as a progenitor of the Sunan model. In 1985, the Wuxi government adopted the following measures: (1) penalties for skilled workers who left collective TVEs for other jobs, including barring their family members from jobs in TVEs; (2) thorough status checks on enterprise registration documents and procedures; and (3) limits on managers’ pay to three times the average payroll (Luo 1990, p. 150).
All of these measures were designed to constrain indigenous private firms by denying them access to quality human capital, raw materials, and finance. And they all succeeded. In 1985, collective TVEs constituted 36 percent of the total number of industrial non-state firms in Wuxi but contributed 96 percent of the gross value of industrial output. The private sector in the industrial arena was inconsequential (Svejnar and Woo 1990, pp. 67–69). In terms of the share of private TVEs in total TVE output, in 1987, Zhejiang had a higher share, at 16 percent, compared with 11 percent in Jiangsu. But the differences grew greater in the 1990s. By 1997, in terms of the share of the private TVEs, it was 52 percent in Zhejiang and 28 percent in Jiangsu (Ministry of Agriculture 2003). Although the two models were formulated in the 1980s, it was the policies of the 1990s that accentuated their economic differences.
After Professor Fei proposed these two models, Chinese economists rigorously debated their respective merits. Now, the debate has been settled overwhelmingly in favor of the Wenzhou model. As I show earlier, the economy of Zhejiang grew faster and its residents are much richer than those in Jiangsu. We can speculate about why a stronger indigenous entrepreneurial economy is more efficient than a combination of statism and FDI. One reason could be that stronger indigenous entrepreneurship is associated with a larger local supply network, which expands local incomes more directly. In contrast, an FDI model relies heavily on export-processing that has low domestic value-added. The profits of this business model accrue to the foreign investors rather than to the local entrepreneurs. Another piece of evidence is that although both provinces have a similar export/GDP ratio, Zhejiang has a far lower import/GDP ratio, as compared with Jiangsu. A stronger local production base also enables foreign firms to source locally. In 2006, the foreign trade balance of FIEs in Zhejiang was US$18.6 billion, compared with US$16.2 billion in the case of Jiangsu (NBS 2007a, p. 741). However, FIEs in Jiangsu exported 3.3 times as much as FIEs in Zhejiang, suggesting a far greater domestic content of export production for FIEs in Zhejiang.
In a statist economy, the primary contributions of FDI may be ameliorative in nature rather than additive to economic growth. That is, efficiency-enhancing FDI contributes to growth by offsetting the inefficiencies of the state sector. So, its contributions to growth are stunted. A counterfactual scenario is that the Sunan model would have done even worse without the FDI. This reasoning may explain why Jiangsu seemed to court FDI more eagerly than Zhejiang: Because Jiangsu systematically suppressed indigenous entrepreneurship, it needed to expend precious resources on importing foreign entrepreneurship. In this scenario, FDI still contributed to growth, but not nearly as much if Jiangsu had had a more vibrant private sector.
2.2 The Indian Model
[T]he Indian manufacturing model, in my view, continues to suffer from three major deficiencies – a lack of infrastructure, a low national saving rate (a little over 20%) and anemic inflows of foreign direct investment (barely $4 billion in 2003).
– Stephen Roach (2004), chief economist of Morgan Stanley, after an arduous six-hour trip from Mumbai to Pune
For a long time, academics and business analysts have compared India unfavorably with China. China grew faster, drew more FDI, exported more, and reduced poverty at a more impressive rate. According to a widely accepted view, the two countries started the decade of the 1990s at the same level of per capita GDP, but China ended the decade twice as rich as India. This latter view, based on GDP data adjusted for purchasing power parity supplied by the World Bank, has powerfully influenced the ways academics and analysts explained their respective growth experiences. The view that China left India behind in the 1990s tilts analytical attention to those developments that occurred in China in the 1990s. The hallmarks of China in the 1990s were massive FDI inflows and huge investments in infrastructure. An extension of this view to India is that the poor quality and the meager quantity of infrastructure explain India's lagging performance.
It is important to adjudicate the timing of China's economic takeoff vis-à-vis India. If it indeed is the case that China became richer than India only in the 1990s, then FDI inflows and heavy investments in infrastructure loom large in the explanation of why China surged ahead. If, however, China was already richer than India by the early 1990s, then it was the policy choices prior to the 1990s that mattered. I show that multiple indicators other than the PPP estimates by the World Bank cast substantial doubt on the notion that China overtook India only in the 1990s.
Although many believe that China left India behind economically, a closer look at the comparative economic performance of China and India reveals a more subtle picture. By the standards of wealth and value creation, the Indian economy, in fact, has some substantial strengths. Indians use less energy and fewer investment resources to generate growth. These attributes of Indian growth should be recognized because they offer a useful lesson to other poor countries. The most important implication from an Indian miracle in the making is the importance of what I call “soft infrastructures” to understand economic growth. Soft infrastructures, such as rule of law, financial institutions, and China's directional liberalism in the 1980s, matter more for growth than the massive investments in hard infrastructures.
Alternative GDP data to the PPP estimates show China to be a far richer country than India long before the 1990s. Dwight Perkins (1986), the world's foremost authority on Chinese economic history, estimated China's GDP per capita in 1985 to be US$500. In the same year, India's GDP per capita was US$270. According to a careful study, China's nutritional levels and consumption of durable goods as of the early 1990s broadly resembled the patterns in Taiwan in the 1970s. Because there is a close correlation between income and consumption patterns, Garnaut and Ma (1993), the authors of this influential study, concluded that GDP per capita for China in 1990 ought to be valued at around US$1,000. India's GDP per capita was US$350 in 1990.32 Maddison presents other comparative data that put China significantly ahead of India as early as 1975. In 1975, China's gross value-added per agricultural worker was 2.3 percent of the US level, compared with India's 1.9 percent (Maddison 1998, p. 113).
The point here is not to suggest that China's GDP per capita was actually US$500 in 1985 or US$1,000 in the early 1990s. Rather, the suggestion is that we should be very skeptical about the prevailing view that China surpassed India due only to its policies in the 1990s. In fact, the PPP estimates of GDP per capita by the World Bank are the only indicator that I know of that shows the two countries to be at the same level of development as of 1990. Every other indicator suggests that China was substantially more developed than India, not just in 1990 but as far back as 1965. Let us take a look at the human development index (HDI) devised by the United Nations Development Programme. In 1975, China had a HDI of 0.527 compared with India's 0.413. (The higher value indicates more advanced development.33) In the 1960s, the Chinese had a longer life expectancy, lower infant mortality rate, and better educational attainments. In 1965, the life expectancy at birth for an average Chinese male was 54 years; for an average Chinese female, 55 years. In contrast, for Indian males, life expectancy was 46 years and for Indian females, 44 years. (India is one of the few countries in the world where men outlived women.) By 1985, the gap in life expectancy between China and India had grown larger. Chinese men averaged 68 years in terms of life expectancy, compared with 57 years for Indian men. For women, Chinese women averaged 70 years, as compared with 56 years for Indian women. In the mid-1980s, China's infant mortality rate was 54 per 1,000, compared with 122 per 1,000 in India. Furthermore, China's primary education enrollment ratio was far higher than that of India as early as the mid-1970s.34 In 1973, the Chinese averaged 4.09 years in primary education, compared with the Indian's 2.6 years (Maddison 1998, p. 63). If the two countries truly had the same level of GDP per capita, one must be prepared to explain this huge gap in their broader socioeconomic achievements.
The idea that China's success owes to its infrastructural investments and FDI is heavily rooted in observation of China of the 1990s. Once we consider the experience of the 1980s, an entirely different picture emerges. In the 1980s, China's economy grew rigorously and the population-weighted household income per capita grew substantially faster than it did in the 1990s. In the 1980s, China attracted very little FDI. The highest level of FDI was US$3 billion, accounting for a trivial portion of China's total investments. Although their growth rates have become closer in recent years, it is beyond any doubt that China outperformed India by a large margin in the 1980s.
There is another little-known fact: In the 1980s, China, in fact, started with an infrastructural disadvantage vis-à-vis India. In 1989, India had a longer network of paved roads (1.4 million kilometers) compared with China (862,000 kilometers) and it had a more developed railway system. In 1975, India, the smaller country of the two, had a railway system 60,438 kilometers in length, as compared with 46,000 kilometers in China. As late as 1995, China still had shorter railway lines (Maddison 1998, p. 51). One measure of the “quality” of the railway system is the length of electrified railways. Here again, India held an advantage over China. In 1989, its electrified railways were 5,345 kilometers long, as compared with only 1,700 kilometers in the case of China.35
To attribute China's economic success to FDI and infrastructural investments is putting the carriage before the horse. FDI and infrastructural investments played a minor role in China's initial economic takeoff. The more factually accurate description of China's growth experience is that growth occurred first, and FDI and infrastructural investments followed, rather than the other way around.
Now India is repeating this story. Despite being a persistent FDI laggard and despite universal complaints about – and scorn for – the fact that India lacks the Chinese level of infrastructure, India's economy is gaining increasing strength. Its GDP growth has inched from the 4 to 5 percent range to above 8 percent in recent years, defying many pessimistic predictions that it could not grow without the Chinese levels of FDI and infrastructure. India will repeat the true China miracle in another way as well – FDI does not put a country on a high-growth trajectory, but once a country grows fast, FDI will come to the country regardless of its infrastructures. With a growth trajectory of 8 to 9 percent, India can easily triple or even quadruple its FDI inflows from the US$6 billion in 2006. This is a smarter way to attract FDI and to build infrastructures. Rising FDI and economic growth will generate resources to self-fund the construction of infrastructures.
India's growth experience is more relevant to that of other developing countries wishing to jump-start their economies. A universal problem among developing countries is the low savings rate. It will be valuable to learn from India how to use limited resources efficiently. India is investing half of what China is investing and yet it is achieving a growth rate around 80 percent of the Chinese growth rate. It will also be valuable to learn from India in terms of how it is able to overcome another massive disadvantage vis-à-vis China – its tropical geography. (China is a temperate country similar to the United States and Europe.) Growing an economy in a tropical environment entails special challenges (Sachs 2001).
India has other well-known disadvantages – its hugely unproductive and counterproductive caste system and its high level of illiteracy. One can focus on these liabilities and bemoan India's growth prospects. Another more productive approach is to focus on those conditions that have enabled India to grow at an impressive rate despite these liabilities. My own candidate variable is India's rigorous soft infrastructures. One can go a step further and argue that India's soft infrastructures must be so good to be able to offset its massive disabilities in other areas.
India's growth has accelerated in recent years, but it still pales in comparison with China. According to the World Development Indicators,36 between 1978 and 2004, annual GDP growth averaged around 9.73 percent a year in China but only 5.37 percent in India. On that basis, many analysts would conclude that China has outperformed India substantially in the past two decades.
Details are important in making comparisons between China and India. The first important detail is that the growth gap between China and India has narrowed. On average, between 1978 and 1997, China grew nearly twice as fast as India, but between 1998 and 2004, China was growing about 50 percent faster. The second detail is that Chinese per capita GDP growth exceeded that of India by a larger margin than its aggregate GDP growth. Between 1978 and 2004, Chinese per capita GDP growth was roughly 2.5 times that of India, but its aggregate GDP growth was 1.8 times that of India. It is this difference in the growth rates of per capita GDP, more than the differential GDP growth rates, that explains the sharp visual difference between China and India. After visiting the two countries, countless visitors have reported that China feels far richer than India.
That China was able to grow substantially faster in per capita terms than in aggregate GDP terms is partially a political story. Although the economically induced declining fertility played a role, there is no doubt that China's draconian one-child policy led to lower population growth in China than in India. India tried a similar program in the late 1970s but voters thoroughly rejected the proposal by Indira Gandhi to enforce a forcible sterilization program. Because both countries have a chronic surplus of labor, it is plausible to argue that the higher GDP growth per capita in China – above that of its GDP growth – is due in part to the greater political capacity of the Chinese government to contain population growth. Leaving aside the issue of whether population control is economically desirable, very few countries can emulate this aspect of China's development strategy.
A hallmark of a market economy is wealth creation. A little-known fact is that the Indian economy is able to create more value and wealth for a given unit of GDP than is the Chinese economy. Despite the widespread belief that China is far more successful than India in the manufacturing industries, it is intriguing to note that, in fact, India has a higher manufacturing value-added per worker than China.
According to data in the World Development Indicators 2001, the value-added per worker in manufacturing was 2,885 dollars per year during the 1995–1999 period for China, but 3,118 dollars per year for India during the same period. More tellingly, however, is the fact that China's value-added in manufacturing declined over time. Most countries upgrade their products and increase their production sophistication as their economies grow, but not China. In the mid-1980s, the manufacturing value-added per worker per year in China was 3,061 dollars, but this figure declined to 2,885 dollars in the late 1990s. India displays a more normal pattern. It increased its manufacturing value-added from 2,108 dollars in the mid-1980s to 3,118 dollars in the late 1990s.37
Maybe India has a different industrial structure as compared with China. This is a point put forward in a paper by IMF economists (Kochhar, Kumar, Rajan, Subramanian, and Tokatlidis 2006). The paper does show some initial differences between China and India. In 1980, India “overly” specialized in those industries that are characterized by high skill intensity, at the expense of those industries characterized by labor intensity.38 But the differences in their starting points still do not explain why manufacturing value-added should decline over time in China. The IMF paper shows that conditional on the initial industry mix between 1981 and 1996, China's share of output in skill-intensive industries was not only lower than that of India, but also China's share experienced a modest decline over time.
GDP is a flow measure, but a person's economic well-being is not just a function of his income but also of his assets – physical or financial – that are being accumulated. A path-breaking study by the World Bank (World Bank 2006b), Where Is the Wealth of Nations?, comes up with monetary estimates of a range of assets in a country. Of particular value, the study divides the assets into several classes – produced, natural, and intangible. This division allows an analyst to separate the endowment factors from those factors endogenous of the economic and political institutions. The data used in the study refer to 2000.
In 2000, the per capita GDP for China was $840 on the basis of the foreign exchange conversion and $3,940 on the basis of the PPP conversion. The two figures for India were $460 and $2,390, respectively. The ratio of the Chinese per capita GDP to the Indian per capita GDP ranges from 1.8 (the exchange rate conversion) to 1.6 (the PPP conversion). By the wealth measures as provided by the World Bank, the two countries are closer to each other. China's total wealth per capita is 9,387 dollars, whereas India's is 6,820 dollars. This gives rise to a China/India ratio of only 1.38. A better measure than aggregate wealth reflecting institutional effects is intangible capital. The vast majority of the wealth in rich countries takes the form of intangible capital because of the higher educational achievements and rule of law. And here is an intriguing finding: China and India are very close to each other in terms of intangible capital despite a near two-fold gap in terms of per capita GDP. China has intangible capital of 4,208 dollars per person, as compared to India's 3,738 dollars. Thus, the ratio of China to India is only 1.13. This is substantially lower than their income differentials. Here, we see a similar difference between the output measure and asset measure of China as we saw in a comparison between Shanghai and Zhejiang. A state-led economic model can build up output capacity very quickly but it does not lead to wealth creation.
It is high time to take a close and careful look at India's growth experience. Its growth, like China's growth in the 1980s, is a result of financial liberalization, private-sector development, and an evolving policy environment that nurtures and fosters indigenous entrepreneurship. Collectively, these constitute what can be termed as “soft infrastructures” for growth. One reason why India was consistently under-estimated by Western analysts is that the analysts focused only on those tangible and physical growth drivers, such as airports and roads. These hard infrastructures support growth, but so do soft infrastructures.
It is easier to see the results of building up hard infrastructures than it is to see the results of building up soft infrastructures. An airport, once built, is visible. It is much more difficult to tell whether or not a country's financial system has improved. Institutions are intangible and their importance shows up in their effects on investment and the work incentives of individuals rather than in a physical manifestation. Even a casual observer can tell the difference in the physical landscape of Beijing between 2000 and 2007 but, without due diligence and some expertise, it is difficult to tell the difference in Beijing's financial system between 2000 and 2007. (This is one reason why academics and business analysts after a superficial exposure to China – especially an obligatory exposure to Beijing and Shanghai – typically have a very positive view of the country.)
For the same reason, it is easy to under-appreciate some of the strengths of India because the progress it has made is mainly in the intangible area of institutions such as financial reforms and privatization, whereas its main deficiencies are in the visible area of hard infrastructures. At the beginning of this section, I quote from Stephen Roach, the chief economist at Morgan Stanley, expressing a widespread sentiment of “Indian pessimism.” That pessimism is rooted in making an inference only on the basis of what is easily observable (to be more precise, what is observable during a short, skin-deep trip, which, by his own admission, left him “exhausted, head-spinning, and with a sore back”). It is a classic observational error that all students in an entry-level methodology class are taught to avoid. As a footnote, after Roach expressed his pessimism of Indian manufacturing in 2004, India registered a growth in manufacturing production and exports in excess of double-digit rates every year. It will not be the first time that India defies the pessimists and proves them wrong.
In the area of finance, the contrast between China and India is especially sharp and the precariousness of Chinese indigenous capitalism is most apparent. We have some fairly systematic evidence from a unique dataset – the World Business Environment Survey (WBES) – to assess the financing environment facing indigenous private businesses in China and India.39 The WBES is the only dataset that this author is aware of that uses the same survey instruments for both countries and that was conducted during the same timeframe (2000–2001). It is this feature of the WBES dataset that allows us to compare the financing constraints in China and India in a somewhat systematic way. Another attractive feature of the dataset is that the majority of the surveyed firms are indigenous private businesses.
Question 38 in the WBES asks the respondents about how problematic the financing constraint is for the operation and growth of their firms. The responses to this question range from no obstacle, to a minor obstacle, a modest obstacle, and a major obstacle. Indigenous private firms in China reported a substantially higher level of financing constraints as compared with their counterparts in India: 80.2 percent of the Chinese firms described the situation as a moderate obstacle or a major obstacle, compared with 52.1 percent of Indian firms. The differential in their responses is even greater if we look only at those firms that gave “a major obstacle” in their responses: 66.3 percent of the Chinese firms compared with only 25.5 percent of the Indian firms.40 I have undertaken a statistical analysis of the WBES data, which allows me to control for a variety of other factors that may also affect financing constraints. The statistical results are identical to the descriptive results reported here (Huang 2006).
The Chinese score for financing difficulties, at 80.2 percent, is very close to those for Russia (79.5 percent), Romania (80.5 percent), Belarus (82.3 percent), Bulgaria (73.3 percent), and so forth. China, although similar to the European transition economies, is dissimilar to its Asian capitalist neighbors, such as Indonesia (50 percent), Malaysia (41 percent), and Singapore (30.3 percent). By contrast, the level of India's financing constraints puts that country squarely in the same league as these Southeast Asian economies. The only plausible explanation for why China's financial system is similar to the European socialist countries is the legacy or the continuation of central planning. India's financial system may be inefficient and cumbersome, but it is at least capitalistic in its fundamental orientation.
The different levels of financing constraints are not an accident but rather a cumulative function of the pace of the financial reforms in the two countries. Both countries implemented some financial reforms at the start of the general economic reforms. China had an earlier start in the 1980s and in the rural areas, but it lagged behind India because it reversed these reforms in the 1990s. By Chinese standards, India's financial reforms were implemented at lightening speed.41 In the first half of the 1990s, the focus was to reduce the ownership stakes of government in banks. (India had nationalized many of the major banks in 1969.) Between 1995 and 1998, several large state-controlled banks, such as Bank of India, Bank of Baroda, and Industrial Development Bank of India, launched initial public offerings. The government stake was reduced to around 50 to 60 percent. This kind of reform began in China's banking sector only after 2005, and the scale of the ownership diversification in Chinese banks has been considerably more modest. Very early on, in 1992, India permitted the entry of new private players into the banking sector. By 2003 or so, these new private banks accounted for 12 percent of the total credit (Banerjee, Cole, and Duflo 2005). In contrast, as Sáez (2004) points out, “the presence of private banks in China is negligible.”
India is often criticized for being protective of its domestic industry, but in the financial sector, India opened itself to foreign competition far ahead of China. In 1998, the government permitted foreign investors to own 40 percent of stakes in Indian banks, doubling the foreign share prior to that time. In China today, foreign ownership is still capped at 20 percent. As of 2003, foreign banks accounted for 8 percent of India's banking assets; in China, at the end of 2002, foreign banks accounted for just 1.7 percent of total banking assets. The example of Citibank in the two countries is illustrative of their dramatic contrast. According to Sáez (2004), as of 2000, the total assets of Citibank in India amounted to $35.8 billion; in contrast, Citibank had $2.5 billion in assets in China, and the assets of all foreign banks in China in 2000 came to only $34 billion. This is about the same as the assets held by one single foreign bank in India: Citibank.
Another clear difference is the role of the stock market. India's stock market is substantially more supportive of indigenous private-sector development. Some of the most competitive technology firms in India today owe their rise to listings on the Bombay Stock Exchange. For example, Infosys issued shares in 1993. This share issuance was critical to the strategic growth of the company. Infosys used the proceeds to build its now famous “Infosys Campus,” which differentiated itself from the dilapidated rest of the country. The firm explicitly used this strategy to win the trust of its multinational customers.42 In contrast, as is well known, very few indigenous private-sector firms could gain access to China's stock exchanges. Unlike their Indian counterparts, some of the most famous Chinese technology firms, such as Lenovo and Huawei, are not listed on China's stock exchange.
Beyond the financial sector, the gap in soft infrastructures between the two countries appears to have grown over time. One example is revealed in the World Economic Forum's growth competitiveness index (GCI).43 In the latest ranking (2007–2008), China is ranked at No. 34, far ahead of India's No. 48. China typically outranks India on the macroeconomic and overall benchmarks, but it is outranked by India on the microeconomic benchmarks. In the 2007–2008 GCI, China is ranked at No. 57 on the business competitiveness index (BCI) compared with India's No. 31. The detailed components of the BCI, such as company operations and strategy, all show China to have a lower ranking than India.
It is interesting to note two features of the GCI ranking. One is that there is an inconsistency between the macro and micro rankings vis-à-vis India. In the long run, an economy grows and performs on the basis of its strong micro foundation. China scores high on the macroeconomic ranking in large part because the macroeconomic rankings are heavily weighted by GDP growth. To the extent that China's GDP growth is faster and to the extent that its GDP growth is heavily powered by the government-sponsored investments, it can score high on the macroeconomic ranking but low on the microeconomic ranking. Either India's macro performance will improve, as it has in recent years, or China's macro performance will deteriorate. This macro-micro inconsistency is unlikely to last forever.
Second, this inconsistency is present only in the more recent GCI rankings. In the earlier versions of the GCI, China outranked India on both the macroeconomic and microeconomic rankings. In 1998, in terms of BCI, China was ranked at 42nd place compared with 44th for India. (This fact answers the skeptical view that the ranking differentials are due to the ways that the indicators are compiled.) Since 1998, India has steadily and quietly improved its microeconomic fundamentals. The effect of these improvements does not show up instantaneously but these improvements will position India well down the road. That India overtook China in microeconomic rankings also debunks the widespread idea that India is now ahead of China in certain areas because India has a longer history of capitalism. This view completely ignores the fact that for 30 years, until the reforms in the early 1990s, India had a highly organized central planning system modeled after that in the former Soviet Union. The fact is that China led India substantially in economic reforms in the 1980s and most likely in the first half of the 1990s as well. India has now overtaken China in microeconomic rankings because China failed to make meaningful reforms in the 1990s.
3 Capitalism with Chinese Characteristics
The economy is still the base; if we didn't have that economic base, the farmers would have risen in rebellion after only ten days of student protests – never mind a whole month. But as it is, the villages are stable all over the country, and the workers are basically stable too.
– Deng Xiaoping on May 19, 198944
This quote is putatively from Deng Xiaoping, who made the comment at the height of Tiananmen turmoil – May 19, 1989, the day the Chinese government declared martial law. As usual, Deng had the most incisive observation of the country. After the collapse of the Soviet Union, many came to the view that China was spared the same fate in 1989 because it did not liberalize its political system. The real reason why China did not collapse in 1989 was that its rural population was reasonably content in the 1980s.
One of the most damaging effects of the policy model of the 1990s is that it undermined the rural stability. Much of the increase in the political and social instability in the 1990s – documented before in the form of rising protests – occurred in rural China. Rising illiteracy will lead to rising crimes. (In a Yunnan prison, 65 percent of the prison inmates were illiterate and 70 percent of them were rural residents.45 The two populations likely overlapped substantially with each other.) The root of Chinese stability is its rural stability. The anti-rural bias of the policy model also entails significant economic implications: It slows down the pace and it alters the nature of China's transition to capitalism.
In this section, let me return to a broad theme of this book – assessing the nature of capitalism with Chinese characteristics. The consensus view among leading Western China economists is that China today is largely a market economy. Yingyi Qian (2003) remarks, “In the last 22 years of the 20th century, China transformed itself from a poor, centrally planned economy to a lower-middle-income, emerging market economy.” Barry Naughton echoes this view. Writing in 2007, he states, “Today, many of the initial challenges of market transition have been overcome. The market is now the predominant economic institution in China” (Naughton 2007, p. 5).
Some of the prominent economists based in China, as compared with Western academics, have a far less sanguine view on the state of reforms.46 Wu Jinglian, probably China's best-known economist, has forcefully argued that without genuine political reforms, China faces a real risk of falling into the trap of crony capitalism. Fan Gang, another well-known economist who sits on the monetary advisory committee of the Chinese central bank, has expressed similar concerns. The data and facts presented in this book are consistent with the views of these academics based in China. In this section, I place the state and evolution of capitalism in China against a broader, comparative perspective. First, I try to answer the question, “What is the best way to characterize the Chinese economy today?” My own characterization is that this is a commanding-heights economy, similar to that of many of the developing economies of 1970s vintage. Is this progress? Yes, in the sense that China has moved from a Leninist to a Nehruian system, but it is a far cry from claiming that the Chinese economy today is based on private-sector dynamism and a market orientation.
I then show that capitalism with Chinese characteristics is fundamentally different from capitalism with East Asian characteristics. The main difference has to do with the role and the size of the private sector. Another difference is the degree to which the state is a grabbing or a helping hand. The East Asian state, even the authoritarian state in Korea or that in Taiwan during the period of their respective economic takeoffs, was by and large benevolent. Corruption existed but the size of the corruption was not endemic. Social performance was excellent and it improved over time. I contrast these aspects of China with those of East Asia.
3.1 Commanding Heights
It was China, after 1978 under the influence of Deng, that accelerated leaving India far behind.…China did this paradoxically by adopting a much more “capitalist road.” While India went on restricting its large native capitalist class after independence, China had to practically reinvent its own bourgeoisie after 1978.
– Meghnad Desai, a former professor at London School of Economics and a member of the British House of Lords (Desai 2003).
It is a remarkable view that China is more capitalistic than India, the world's largest democracy and a country with a continuous history of capitalism. Professor Desai is by no means among the minority of scholars to make this claim.47 Similar comparisons are frequently made in the business media, claiming that China is a more vibrant, more capitalistic economy than India. Let us confront these views with some data.
According to the OECD study cited in Chapter 1, the Chinese private sector – covering both agriculture and industry – accounted for 70 percent of GDP as of 2003. I explained why this figure is a substantial overstatement of the Chinese private sector: The estimate includes the output by those legal-person shareholding firms that are still substantially owned by the state. Let me add another reason here. The assumption that agriculture in China is completely private is increasingly questionable in light of a development since the late 1990s – the massive land grabs that have rendered land leaseholds insecure.
For the sake of argument, let me ignore these computational complications and take the OECD's claim of 70 percent at its face value. Clearly, by the OECD estimate, China has moved substantially away from the centrally planned economy of the 1970s. But, we need to have an appropriate perspective here. For sure, 70 percent is high by the standard of centrally planned economies, but it is not at all high by the standard of capitalist economies, even some of the most statist capitalist economies. To illustrate this point, let us go back to the 1970s. This was a decade at the apex of the commanding-heights ideology. Among developing capitalist and statist economies, many far exceeded 70 percent of GDP in the private sector. Take Tanzania as an example. Under the radical leadership of President Julius Nyerere, Tanzania adopted a socialist economic model and yet, in 1978, the private share of its GDP was nearly 90 percent. In Brazil, the private share of GDP was 94 percent; in Venezuela, 73.9 percent (World Bank 1995, pp. 300–302).
What about Professor Desai's assertion that China is more capitalistic than India? For the sake of the argument, I again take at face value the OECD claim that the Chinese private sector, inclusive of foreign firms, was producing 52.3 percent of industrial production in 2003 and 71.2 percent in 2005. I set a low bar for China – comparing China of the 2000s with India of the 1970s at the height of its economic statism. India at that time was at the apex of its commanding heights after Indira Gandhi nationalized all major banks, significantly expanded the scope of “License Raj,” and created numerous barriers for the private sector. But, even at the height of the “License Raj,” the importance of the Indian private sector was comparable to the level of the Chinese private sector in 2005. One estimate puts the share of private-sector firms in total manufacturing GDP in India at 93 percent in the early 1960s and at 69 percent in 1983–1984. The share of fixed-asset investments of the private sector was around 58 percent,48 a ratio that is substantially higher than the broadest definition of the Chinese private sector as reported in Chapter 1: 33.5 percent in 2005 (and only 17.2 percent as recently as 1998). Thus, even a generous accounting of the current size of the Chinese private sector puts China roughly in the same league as one of the world's most statist economies of the 1970s. (It should be stressed that the OECD's estimate of China's private sector is inclusive of foreign firms, so this comparison is not affected by differences in FDI policies.)
One specific component of Professor Desai's comparison between China and India is especially off the mark. He argues that India restricted its “native capitalist class,” whereas Deng's China encouraged it. China in the 1980s did encourage its “native capitalist class” (mainly in the rural areas), but in the 1990s, it went in a different direction. If we compare China of the 1990s with India, Professor Desai got the facts backward. The government of Indira Gandhi severely restricted the activities of multinational corporations (MNCs) in order to protect domestic businesses. Many firms, such as IBM and Coca Cola, left the country altogether.49 Recall the finding in Chapter 1 that the size of the Chinese indigenous private sector relative to the foreign private sector is very small and the findings in Chapter 4 and earlier in this chapter that Shanghai and Jiangsu systematically restricted indigenous private entrepreneurship while eagerly courting FDI. My point here is not to suggest that India of the Indira Gandhi era pursued the right economic policies; there is plenty to suggest that her policies were hugely counterproductive. Rather, the point is that there is no evidence whatsoever that China since the early 1990s has been a more nurturing environment for indigenous capitalism than India.
3.2 How East Asian Is China?
Baumol, Litan, and Schramm (2007) classify China as an example of state-guided capitalism, similar to that in Japan and Korea. We can debate about the accuracy of this empirical classification. In the 1980s, as the present book shows, China moved quite far toward entrepreneurial capitalism in its countryside. Urban China remained state-controlled but, because the vast majority of the population was rural then (and now), the entrepreneurial capitalism in the rural areas had a disproportional effect on the economy and brought about broad-based economic success.
The issue is whether Chinese capitalism today is closer to that in East Asia or that in Latin America. (Here, East Asia refers to Japan, South Korea, and Taiwan.) Regardless of one's views on the wisdom of the industrial policy approach of the South Korean government during that country's economic takeoff, the microeconomic foundation of that country was completely private. Most of the corporate entities in the Korean economy, such as Hyundai, Samsung, Kia, and LG, were privately owned. The entire banking sector was privatized in 1982. According to one estimate, in 1990, bank claims on official entities – including local governments, government investment institutions, and SOEs – were only 4.5 percent the size of the claims on the private sector (Haggard and Huang 2008).
Taiwan is another private-sector success story. According to Kuo, Ranis, and Fei (1981, pp. 80–81), 24 percent of loans were going to private enterprises in 1953 and this figure increased to 77 percent in 1979.
Let us take a look at China. We have fairly detailed loan data by ownership for short-term loans. (Long-term loans to the private sector are most likely even smaller.) In 2002, the percentage of short-term loans to the private sector – defined here as all TVEs and agricultural and private-sector businesses – was 19 percent (People's Bank of China 2003). This is nowhere near the level in Taiwan in 1979, but it is close to that during the statist era of Taiwan in 1953. Other analysts identify China with East Asia in terms of performance. They point to the fast GDP growth, rising export competitiveness, and rapid industrialization as common features in both China and East Asia.50 Since the late 1990s, China has been investing a rising portion of its GDP – almost half in 2005. China economists have rationalized that this is similar to investments of other East Asian countries.51
The claim that China's investment/GDP ratio is comparable to that in East Asia in the 1970s is not accurate.52 The investment/GDP ratio in China increased substantially in the 1990s, from the 35 percent range in the 1980s to the 40 to 45 percent range in the 2000s. China seems to have acquired a permanent addiction to investments. In 2005, the country invested 48 percent of its GDP in new fixed assets; in 2006, it invested 52 percent (NBS 2007a, pp. 26–27).53 At 35 percent, China in the 1980s was quite close to that in Japan – around 33 percent in the 1970s – and within striking distance of Taiwan (around 26 percent). In the 45 to 52 percent range, China is in an entirely different league. Korea had the highest investment/GDP ratio in East Asia. The height was 40 percent in 1990, but this was a one-off event. In the 1970s and 1980s, the ratio was within the normal East Asian range of around 30 percent.
The second difference with East Asia is the ownership composition of the investments. In East Asia, an overwhelming portion of investments took place in the private sector. In China, the opposite is the case. Take Korea as an example. It is true that the investment/GDP ratio rose from an annual average of 19.3 percent in the 1970s to about 32.3 percent in the second half of the 1980s, but the private sector led the way in this investment surge. On average, private-sector investments accounted for more than 70 percent of total investments in the 1970s and this ratio rose to more than 80 percent in the 1980s. So Korea started out in the 1970s with a higher level of private-sector investments and, over time, the private-sector investments grew even larger. China, on the other hand, started out with a weaker private sector in the early 1980s, when its share was only around 20 percent as shown in Chapter 1, and ended up even weaker in the 1990s. This is not an East Asian story at all.
The strength of the indigenous private sector is really the essence of the East Asian model. According to Campos and Root (1996), East Asia did not invest at an inordinately high level as compared with Latin America. What distinguished the higher-performing East Asian economies was the high proportion of private investments. The high state share of investments puts China closer to Latin America than to East Asia. There is another East Asian difference with China. Except for Singapore, FDI played an insignificant role in the extremely successful export production of the East Asian economies. In the mid-1970s, FIEs in Taiwan accounted for only 20 percent of Taiwan's manufactured exports.54 In China today, the ratio is more than 60 percent.
Students of East Asia all agree that the state was interventionist during the growth period (Wade 1990), but the state interventions were ultimately market conforming.55 Consider the famous example of Formosa Plastics. The government on Taiwan established the firm but it did not intend to run it. Instead, the government recruited Wang Yongching, a businessman who was not even living in Taiwan at the time, to run the firm. Wang subsequently built Formosa Plastics into the world's largest PVC producer. Li Kuoting, the father of Taiwan's economic miracle, constantly exhorted his government colleagues to look at “things from the entrepreneur's point of view.”56
Contrast this with China's top-down approach. In the 1990s, China strongly promoted a number of industrial policies but the Chinese industrial policy initiatives drew almost no input from the business community, not even from the SOEs. According to a 1998 survey, only 4.5 percent of respondents believed that enterprises and enterprise associations played a key role in industrial policy making; 65 percent of the respondents said that only the central government was responsible. When asked if the government's market forecast was correct, more than half of the respondents answered in the negative (Zhao 1998).
There are sharp differences in the area of social performance between China and East Asia. Here, it is important to have a precise idea of what the “East Asian miracle” means. The East Asian miracle does not only refer to the fact that East Asia grew rapidly; during its period of growth, East Asia also had excellent social performance. In East Asia, the Gini coefficient was low at the start of the economic takeoff and remained low during the takeoff. In Korea, the Gini increased modestly from 34 in the mid-1960s to 36 in the early 1980s. In the case of Taiwan, the Gini actually declined from 36 to 31 during the same period.57 China, as documented previously, has experienced a sharp rise in the Gini. This is not a story of “rapid growth with equity.”
3.3 The Grabbing Hand of the State
Historically, some of the capitalist countries used all sorts of means to squeeze out the peasants, forcing them to enter into bankruptcies and to become a source of cheap labor.…
– Wan Li (1992 <1982>, p. 145), vice premier of China, 1984–1988
The poorest man may in his cottage bid defiance to all the force of the Crown. It may be frail; its roof may shake; the wind may blow through it; the storms may enter, the rain may enter – but the King of England cannot enter; all his forces dare not cross the threshold of the ruined tenement!
– William Pitt, Prime Minister of Britain, 1766–1768
The authoritarian states of East Asia, by and large, were benevolent. Park Chung-Hee, the leader who created Korea's economic miracle, exemplifies this combination of supreme power and deliberate self-constraint. Although ruling with the iron fist of a military general, Park was methodical and conscientious in his economic management. (“There was a method to his madness,” as political scientist Meredith Woo grudgingly admired.) Never a man of political patronage, he ruthlessly held his subordinates accountable to his high and strict meritocratic ways. On the eve of each New Year, he would visit his cabinet ministers to discuss goals and strategies for the upcoming year and followed up with a performance check one year later. Those who failed more than 80 percent of the targets were fired on the spot (Campos and Root 1996, p. 140). He scrupulously avoided creating perceptions of bias and cultivated policy credibility. He made a practice of meeting with businesspeople only in large groups in which the businesspeople acted as representatives of their industries rather than as representatives of their firms (Johnson 1987).
The East Asian states invested heavily in education and public health and expanded the social opportunities for their citizens. Corruption existed in East Asia but was unlikely to approach the pervasiveness of China today. Land grabs, currently an endemic problem in China, were unheard of in East Asia. It is widely acknowledged that land reforms, which solidified the private ownership of farmers, laid the foundation of the East Asian economic miracle. For whatever reasons, the East Asian states governed in ways that maximized the public interest.
By contrast, the Chinese political system became increasingly self-serving in the 1990s. A blatant illustration is how it enriched itself at the expense of the society at large. Between 1989 and 2001, the Chinese government increased the salaries of its civil servants five times – and four times between 1998 and 2001 – and each time by a double-digit rate.58 As a result, civil servants today are among the best paid and the most desired professions in China. In a 2007 survey, college students in Beijing ranked a government job as the second most desirable, after a job in a MNC. (In the same survey, 13 percent wanted to work for SOEs and only 1 percent wanted to work for the domestic private sector.)
An official rationale for increasing the salaries of civil servants was to counteract the recessionary effect of the Asian financial crisis by boosting internal consumption. (Another rationale – i.e., to reduce bureaucratic incentives to accept bribes – was patently false given that the amount of bribes in the 1990s amounted to millions of yuan.) But the same bureaucracy repeatedly reduced the incomes of those with the highest propensity to consume – China's rural poor. Between 1997 and 2002, the Chinese state lowered the official rural poverty line – which entitled the poorest people to very basic assistance – three times, matching perfectly in timing with the four salary raises for civil servants. In 1997, the rural poverty line was stipulated at 640 yuan per person. This was reduced to 635 yuan in 1998 and 625 yuan in 1999. In 2001, it was raised to 630 yuan, only to be reduced again to 627 yuan in 2002. As in other areas, the poverty line was adjusted upward under the leadership of Hu Jintao. In 2003, it was 637 yuan and in 2006, it reached 693 yuan.59 The aforementioned figures are nominal; after adjusting for inflation, the official poverty line has never exceeded the level established in 1987.
The Chinese state today – especially at the local level – is dangerously proximate to “a grabbing hand,” a term coined by Frye and Shleifer (1997) to describe the Russian state of the 1990s. Exercise of power for pecuniary interest and corruption were hallmarks of Russia's distorted transition to oligarchic capitalism. In the Chinese context, the state literally grabs – for land. At the beginning of this section, I quote from Wan Li, the vice premier in charge of agriculture in the 1980s and a liberal reformer who launched the rural reforms in poor Anhui province. He was warning against what he believed to be a widespread practice in capitalist countries – the massive taking of land from the peasants that drove them to become a source of cheap labor. He might have worried too much about the capitalist countries. The quote from William Pitt, the prime minister of Britain during the primitive stage of that country's capitalist development, shows that property rights were more secure than credited by Wan Li.
With remarkable prescience, Vice Premier Wan was right on target in his 1982 comment, not about the capitalist countries but rather about China since the late 1990s. In Chapter 3, we saw that the per-day earnings in local non-farm activities dropped sharply in the 1990s (although the migrant per-day earnings increased). Many urban businesses refused to honor their wage contracts and they accumulated massive wage arrears to migrant workers. The situation became so egregious that the Chinese premier personally intervened to resolve several cases of late wage payments. A Chinese reporter, quoting from the All-China Federation of Trade Unions, reveals that the cumulative wage arrears at the end of 2003 stood at 100 billion yuan.60 China has even resurrected slave labor. One infamous case, exposed in 2007, involved 570 slave laborers forced to work eighteen hours a day and seven days a week in a kiln in Shanxi province.
Macro data also show that the labor share of GDP declined throughout the 1990s. According to Li Daokui, an economist at Tsinghua University, the labor share of GDP declined from 53 percent in 1990 to 48 percent in 2005. Li points out that China has one of the lowest labor shares of GDP in the world. Most countries vary between the 60 and 80 percent range.61 Land grabs may have contributed to this adverse development for the Chinese working class. The first effect of land grabs was the uprooting of a large number of farmers. These farmers then flooded the labor market and further reduced the bargaining power of labor in a populous country struggling to create employment opportunities. Taxing rural China heavily – by charging school fees – was another factor. One effect of failings in rural basic education has been the early release of young people onto China's labor market. We can view the 30 million newly illiterate Chinese as 30 million additional members of the workforce. The labor supply increased due to these dynamics.
The most systematic evidence for the scale of the land grabs comes from a joint research project between researchers at the Chinese People's University and Michigan State University.62 They report that nationwide land grabs have increased 15-fold over the past decade. According to their survey, covering nearly 2,000 rural households scattered in 17 provinces, 83 percent of which comprised the rural population, 27 percent of the rural households either experienced or witnessed one or more incidents of government land-taking since the late 1990s. If their survey remotely captures the reality of rural China, the number of people and the degree of livelihood affected by the land grabs are on a truly phenomenal scale.
The land grabs may explain several phenomena documented in this book. In Chapter 3, we saw that although the aggregate rural income rose since 2002, the non-farm business income stagnated. In Chapter 1, we saw that private rural fixed-asset investments failed to grow despite a more pro-rural and liberal policy environment under Hu Jintao and Wen Jiabao. It is quite possible that the land grabs have undermined the security of property rights so much so that rural private entrepreneurs have stopped investing.
The land grabs are not only a rural affair. Forced evictions of long-term residents to make way for new development projects have occurred in numerous cities, including Beijing, Shanghai, and Guangzhou.63 These evictions – as well as the land grabs in the rural areas – have often taken place with the full connivance of local governments and despite the repeated prohibitions issued by the central leadership of Hu Jintao and Wen Jiabao. The most likely reason for the land grabs in the rural areas and forced evictions in the urban areas is corruption. Politically connected developers bribe government officials to acquire sweetheart deals on the one hand and to lean upon the coercive power of the state on the other – as the entrepreneur who gained the management rights to the new Xiushui Market did – to enforce the eviction orders.
Corruption is not new in China, but the general consensus is that corruption intensified massively in the 1990s. The extent of the scale of corruption is illustrated by the amount of the bribes involving the highest levels in the Chinese political system. According to a study of all the reported bribery cases involving government officials at or above the rank of minister or provincial governor from 1986 to 2003, in the 1980s, the highest amount of a bribe was 16,000 yuan paid to a vice governor of Xinjiang province (Sun 2004, pp. 46–49). This compares with the highest bribe between 1990 and 2003 of 40 million yuan. The second highest was 25 million yuan and the third highest was 18 million yuan. The lowest amount of a bribe in the 1990s was 64,000 yuan, an offense committed in 1994. In nominal terms, the lowest amount of a bribe in the 1990s is four times the highest amount of a bribe uncovered in the 1980s and 2.3 times in real terms. Corruption in the 1980s can be described as individual cases of malfeasance; in the 1990s, it has intensified to a systemic proportion.
There is an entirely different style of corruption in China now. Pei (2006, p. 21) notes that corrupt officials in China have become younger. Of those officials caught for corruption in the province of Henan, 43 percent were between the ages of 40 and 50. One would normally think that officials in the prime of their careers would be more circumspect. Corruption today takes the form of grand theft and insider looting, not just under-the-table deals. Liu Jinbao, an executive at the Bank of China's branch in Hong Kong, stole 41 million yuan from the bank. In another case, managers at the Bank of China branch in Kaiping in Guangdong province stole US$483 million from 1997 to 2002 (Pei 2006, p. 118). Furthermore, corruption is no longer the exclusive domain of politicians and SOE managers. In a semi-official 2006 blue book on education, the authors devote two chapters to “unhealthy practices” and “corruption” in the field of education (Yang Dongping 2006).
4 China’s Prospects
We had been in the largest boom in Mexican history. And for the first time in our history, in those years 1978 through 1982, we were being courted by the most important people in the world. We thought we were rich.
– Silva Herzog, finance minister of Mexico, reflecting on the period leading to the debt crisis of 198264
This quote from the Mexican finance minister in the 1970s reminds us of the era when countries such as Mexico and Brazil were viewed as economic miracles. They were the darlings of foreign investors and their GDP growth was extraordinarily rapid. But, over time, their growth began to stagnate. The entire decade of the 1980s was lost for Latin America and in the 1990s, after a brief period of surging growth and rising FDI, the Latin American region slowed down again. Many of the countries in the region are plagued by poor social and microeconomic fundamentals. If there is one lesson from the experience of Latin America for China, it is that FDI is neither the necessary nor the sufficient guarantee for economic prosperity.
China today is a darling of foreign investors, but it should heed another lesson from Latin America as well: The sentiments of foreign investors are poor predictors of long-run economic prosperity. In the final section of this book, I attempt to assess China's economic prospects for the next decade or so. The overall view of this book is that China faces substantial challenges in its transition to a genuinely efficient form of capitalism. I emphasize two microeconomic challenges in particular. The first microeconomic challenge is the deterioration of China's productivity performance. This is a very worrisome development, but few economists have noted or thought about its deep implications. The low productivity trend can be indicative of significant macroeconomic volatility and slowdown in the future.
The second microeconomic challenge has to do with what I call “a matching problem.” This is a situation in which the most innately competitive and capable firms are not matched with resources – broadly defined to include capital and legal support. Private-sector firms, although efficient and innovative at the firm level, lack resources to compete effectively. They have devised various coping mechanisms – including, for example, focusing on less resource-intensive products or production technologies and adhering to low-cost and low-margin business models. This strategy has become increasingly untenable as China faces revaluation pressures on its currency and a sharply adverse external operating environment.
The next five years – the term of Hu Jintao – will be a critical period for China. The leadership of Hu Jintao is a monumental improvement over that of Jiang and we already have some preliminary data to illustrate this judgment. In this section, I provide an assessment of Hu's leadership so far. Although the assessment is largely positive, I also highlight some potential risk factors. One risk is expectational. A clear change associated with Hu Jintao is the rhetorical emphasis on equity, responsiveness of government, and accountability. This policy rhetoric may raise expectations in a political system fundamentally resistant to change. Another group of risks is economic in nature. These include the emerging challenge of managing transparently apparent asset bubbles and their deflation, rising cost pressures, and inflation. The Chinese state has “muddled through” many difficult problems before; the issue is whether the political system as currently constituted is capable of managing a perfect-storm scenario in which political and economic risks converge.
4.1 Is China's Growth Sustainable?
In the concluding section of Chapter 3, I posit that the repression of entrepreneurship in the 1990s led to a switch in growth strategy. In the 1990s, the Chinese government at all levels began to embrace a growth strategy centered on large-scale infrastructural and urban investment projects. The visual transformation of some of China's metropolises has been dramatic. Shanghai, Beijing, and Chongqing demolished massive tracts of old neighborhoods to make way for some of the world's most avant-garde skyscrapers. Many of these buildings carried astronomically high price tags. The Bank of China building and the National Theater in Beijing reportedly each cost more than US$200 million and the building for China Central Television, also in Beijing, is reportedly to have cost more than US$800 million. Across the country, local governments spent lavishly building office towers – for themselves. Fixed asset investments in government buildings and properties, as I showed in Chapter 3, rose sharply in the 1990s. With the 2008 summer Olympic Games scheduled to take place in Beijing, the investment boom has reached a frenzied level.
Many equate skyscrapers in Beijing and Shanghai with economic dynamism. I would argue that the rapid transformation of China's urban landscape – much of it forcibly induced by government rather than by market forces – is an exact symptom of what is deeply wrong with the country. Many of these urban building projects do not raise the long-run productivity and economic potentials of the economy, even though they boost growth in the short run. Since the late 1990s, China's GDP has grown at a double-digit rate every year, the highest growth during the reform era. But this rapid growth is deceptive. It is due in part to the fact that the state can mobilize a huge amount of resources very quickly and thus can invest a large quantity of capital within a very short period of time, whereas had there been investment spending by the private sector, this would have stretched over many years. The growth is thus more compressed as compared with investments by the private sector, but the quality is likely to be poorer.
The financial costs of these skyscrapers, as stratospheric as these skyscrapers themselves, do not even begin to describe the full adverse effects of these urban investment projects. The opportunity costs are massive. Because the country has chosen to invest so much in its urban areas, it must be true that it has not invested elsewhere. At the beginning of this chapter, I provided evidence for the emerging manifestation of this investment strategy: China's poor people in the rural areas were heavily taxed – in the form of high fees for public services – to finance the transfer from rural to urban areas. One result is rising illiteracy – to the tune of 30 million people – between 2000 and 2005. From both an economic and a social perspective, China made a costly tradeoff.
China made other economically unproductive tradeoffs as well. Consider the following postulation: Rural China is more market-oriented and more efficient. Taxing rural China to subsidize less efficient urban China entails a very specific consequence – trading off efficiency in favor of investment scale. We now have convincing evidence that productivity growth has slowed down substantially since the late 1990s. This slowdown of productivity means the current rapid GDP growth rates are not sustainable.
Much of the productivity research focuses on the reform era as a whole65 rather than examining the different subperiods within the reform era. With the passage of 30 years since the reforms began, it is legitimate to ask, as I have throughout this book, if there is any difference in China's productivity performance during different periods of the reform era. Decomposing China's reform era shows that the total factor productivity (TFP) – a comprehensive measure of the productivity performance of an economy – has slowed down considerably since the mid-1990s compared with the 1980s and the early 1990s. I review several published and unpublished studies of TFP in China and summarize their main findings in Table 5.2.
Table 5.2. Estimates of annual TFP growth in the Chinese economy (%)
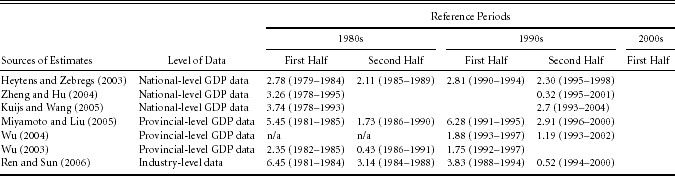
Notes: Kuijs and Wang (2005) estimate TFP growth to be 3 percent in the 1978–2004 period and 2.7 percent in the 1993–2004 period. On the basis of their estimates, I have calculated TFP growth to be 3.74 percent in the 1978–1993 period.
Sources: See the table for citation information.
Because of different assumptions, the estimates of TFP growth differ across these studies but they converge on trend findings. They all show that TFP growth in the last period (i.e., in the late 1990s or early 2000s) was considerably more modest than TFP growth in the 1980s and the early 1990s. For example, Zheng and Hu (2004) report that TFP grew annually by 3.26 percent between 1978 and 1995, but during the 1995–2001 period, TFP growth virtually disappeared (0.32 percent). Focusing only on Chinese industry, Ren and Sun (2006) report a reduction in TFP growth of a similar magnitude. During the 1988 to 1994 period, TFP grew annually by 3.83 percent, but it slowed down dramatically to 0.52 percent in the latter half of the 1990s.66 Despite differences in the level of the data aggregation, every study shows declining TFP performance in the late 1990s.
The sources of TFP growth also bear upon this point. Heytens and Zebregs (2003) show that the role of labor re-allocation, rather than structural reforms, grew considerably in the late 1990s in accounting for Chinese TFP growth. In their estimation, the single largest source of TFP growth is the re-allocation of labor out of agriculture into the higher value-added manufacturing and service industries. During the 1979–1994 period, structural reforms – an index of the share of the non-state sector, the share of trade in total output, urbanization, and the rate of capital formation – accounted for about 33.8 percent of TFP growth. The importance of labor re-allocation increased dramatically during the 1995–1998 period and the importance of the structural reforms was reduced by half. The structural reforms accounted for only 17 percent of TFP growth during the 1995–1998 period. These findings contradict the view that the reforms were deepening in the 1990s and they are consistent with the theme of this book that the reforms stagnated in the 1990s.
The recent productivity performance is very ominous. Productivity performance is not only the most reliable indicator of China's long-run prospects for growth but also of the short- to medium-run stability of its macroeconomy. The Asian financial crisis in 1997 was preceded by the well-documented productivity slowdown (Young 1992; Krugman 1994). The structural conditions for a financial crisis are abundantly present in China today. There is a weak financial system, an overvalued stock market, a deteriorating social foundation, and an underdeveloped indigenous corporate sector. Compared with Southeast Asia, China is poorer, and the effects of a financial crisis in China will be very grave.
4.2 The Matching Problems
China is known as the factory of the world but, in 2007, this formidable image came under increasing strains. Massive quality problems in a wide range of imports from China, such as toothpaste, toys, food, and tires, were uncovered. Mattel, the maker of popular toy items such as Barbie dolls, had to recall millions of its products manufactured in China. In one case, Mattel discovered its supplier was using lead paint that was expressly forbidden in the order contract. Unlike South Korea and Taiwan 20 to 30 years ago, which also started with low-quality products but rapidly upgraded, China seems to have persisted with a low-cost and poor-quality business model over a prolonged period of time. Also unlike South Korea and Taiwan where the quality issues were a “teething” problem naturally characteristic of early industrializing economies, in China many of the quality problems were not due to lack of knowledge. Chinese firms knowingly and deliberately committed fraudulent business practices in order to skimp on costs.
There will be another challenge as well to China's low-cost and low-margin business model. China is facing enormous economic and political pressures to revalue its currency. On the political front, the United States and the European Union have threatened punitive actions if China does not revalue its currency further. On the economic front, the inflows of capital into the stock market and real estate sector have exerted upward pressures on the yuan. Currency developments hold grave implications for the export-oriented private-sector firms, on top of a probable slowdown in the export demand from the United States.
Between 2005 and 2007, Chinese currency has gradually appreciated by almost 10 percent (from Y8.3 to US$1 in March 2005 to about Y7.5 in November 2007). The experience of the East Asian economies in the 1980s and 1990s can provide some guidance. Japan, Korea, and Taiwan faced similar appreciation pressures but at a time when they were far richer than China is today. When Japan revalued its currency between 1985 and 1995, the Japanese corporate sector boasted Sony, Toyota, and Honda. These extremely capable and agile Japanese firms rolled out new products, upgraded their technology, and moved production offshore to digest the costs of the revaluation.
The Chinese corporate sector today is in a far weaker position and we now have evidence that in the last two years, Chinese private-sector firms have done very little to prepare themselves for a new currency environment. The latest private-sector survey in 2006 (PSS2006) contains the most up-to-date information about the capabilities of private-sector firms. Because Chinese currency had already begun to appreciate prior to the survey, PSS2006 should reflect any strategic adjustments private-sector firms have made to prepare themselves for a new currency environment.
The experience of Japanese firms suggests that investing abroad was a critical component of the strategy to respond to the currency appreciation. In contrast, very few Chinese private-sector firms have set up operations overseas. In the PSS2006, only 1.9 percent of the firms reported having overseas operations. This is nearly identical to the 2 percent reported in PSS2004. Another test is whether Chinese private-sector firms have increased their R&D activities. The PSS2006 shows no change in R&D activities from those reported in PSS2004. In both surveys, about 41 percent of the firms reported having some R&D expenditures. Exactly the same number of firms reported owning intellectual property rights in the two surveys (about 16.7 percent). By one measure, in fact, the Chinese private-sector firms were less focused on R&D in 2006 than they were in 2004. The median value of R&D expenditures in the PSS2006 was 200,000 yuan, compared with 300,000 yuan in PSS2004. All of these indicators are not very encouraging that China will be able to withstand a substantial currency appreciation.
After 30 years of rapid economic growth, China's private sector today is still very immature. According to a comprehensive study of China's private sector conducted by the International Finance Corporation (IFC), a distinctive characteristic of Chinese private firms is their informality. Their business practices are opaque, on purpose. It is said that China's private-sector firms keep three sets of accounting books – one for the government, one for the bank, and one for themselves. They frequently shift their business focus and pursue short-term goals rather than building up long-term competitive capabilities. Very few private firms have graduated from the initial founding stage in the life cycle of the firm. They are tightly controlled by the immediate family members of the founders and are lacking in professional management (Gregory, Tenev, and Wagle 2000). More recent data, such as PSS2006, reveal exactly the same picture.
The persistence of a business model centered on low costs rather than technology and upgrading and the lack of maturity in the corporate development of Chinese private firms are results of two matching problems in the Chinese economy. One is that political legitimacy, legal support, and financial resources are not matched with the most efficient firms in the economy – private-sector firms and entrepreneurial businesses that have an arm's length relationship with the government. The adverse business environment then hampers the expansion and corporate development of Chinese private-sector firms. Private entrepreneurs, instead of focusing on business and product development, spend their time cultivating particularistic ties with the government and currying political favors. Rather than investing in technology and product quality, this is the focus of their competitive strategy. Valuable time, talents, and efforts are lost to rent-seeking activities. For example, an analysis of data from PSS2002, PSS2004, and PSS2006 shows that Chinese private businesses are far more interested in donating to “glory projects” – heavily prodded by the government – than financing social protection and health insurance programs of their employees.
The second matching problem is a function of the way in which capitalism has evolved in China. Throughout this book, I have shown that the most rigorous entrepreneurship is rural in origin. Rural China is more liberal but it is also less capable – in a technical sense. It lacks deep engineering talent and industrial know-how. Take the example of Zhejiang. The province is the most laissez-faire economy in China but it is heavily rooted in agriculture. The province received very few industrial investments from the central government in the 1960s and 1970s and is relatively poorly endowed with industrial and technical capabilities. This, in turn, means that firms in Zhejiang had to start at a lower level and with a steeper learning curve as compared with firms in Beijing and Shanghai. It took them a longer period of time to master the technology and acquire the sophisticated human capital.
There is a geographic mismatch: Economic efficiency is rural but technical efficiency is urban. This mismatch has a cost. Think of a counterfactual scenario in which Shanghai and Beijing firms were privately owned and were allowed to operate in a liberal environment. Those firms would have had ample access to the deepest talent pool in the country and could have upgraded their products and technology at a faster speed. Had the Chinese reforms unfolded in both the rural and urban areas, the Chinese corporate sector would have been more capable and competitive and would have been in a stronger position to withstand the shocks of a currency appreciation. The corporate and technical immaturity of the Chinese corporate sector is a long-lasting cost of the way in which Chinese capitalism has evolved.
4.3 Emerging Risks
China has made genuine progress in economic development and in market reforms. This is not to be denied. But the overall tone of this book is one of caution. Consider the following fact. If we redraw the poverty line at $2 a day rather than at the conventional $1 dollar a day, 45 percent of the Chinese population still lives below the poverty line (World Bank 2003). With 30 years of double-digit growth, China has successfully tackled extreme poverty but it is still a fundamentally poor country.
Can China succeed in becoming a prosperous country like its East Asian neighbors? I would argue that the policies of the 1990s detracted China from its growth trajectory and put the country on the wrong path. The good news is that the current generation of leaders – Hu Jintao and Wen Jiabao – is attempting to steer China in a different direction. Recall the finding in Table 5.1 that rural income growth began to recover since 2002. The average growth of rural household per capita income between 2003 and 2005 was 5.8 percent, compared with 3.9 percent during the Jiang Zemin era. This is a substantial improvement. Social performance began to turn around under Hu Jintao as well, such as a modest decline in household educational expenditures.
Hu Jintao's policy formulations, such as the harmonious society, scientific development concept, and energy efficiency, are significant adjustments to the model of heavy investments and rapid GDP growth at all costs in the 1990s. Some of the policy adjustments are subtle but deeply meaningful. For example, we have seen in the case of Shanghai very low levels of asset incomes. In his political report to the 17th Party Congress convened in October 2007, Hu Jintao explicitly stressed the importance of increasing average household asset incomes.67 Although this is less explicit, he also seemed to recognize the divergence between GDP growth and household income growth, a development I identify in this book as a product of the policy model of the 1990s. In the political report, Hu stresses the growth of household income ahead of GDP growth.
Rural issues are once again the priority of the policy agenda. In a sign that signals a return to the policy model of the 1980s, since 2004, the leadership of Hu Jintao and Wen Jiabao has issued consecutive No. 1 documents focusing on rural issues. (I describe this approach of the 1980s in Chapter 2.) The Chinese government has also begun to acknowledge the dire situation of rural finance. Some efforts have been made to revive the deeply troubled rural credit cooperatives (RCCs) and to permit more competition in financial services. During his five years of leadership, Hu has also begun to address many of the social imbalances. The government has completely abolished agricultural taxes, started to reduce or waive educational charges in the rural areas, and experimented with a basic health insurance program that will cover the entire rural population by 2010.
In an unmistakable political gesture, Hu Jintao arrested one of the most prominent members of the Shanghai faction, former Shanghai Party secretary Chen Liangyu, on corruption charges. He has begun to tackle the ever-deepening corruption problems in a determined fashion, and he has signaled his intention to undertake some gradual and modest political reforms designed to permit a degree of intra-party democracy. According to one account, in his political report to the 17th Party Congress, he mentioned the word “democracy” no less than 61 times (Kahn 2007).
In a political system staffed with more than 40 million officials who have a deep-vested interest in the status quo and who are blatantly self-serving, a top-down political and policy adjustment will entail some substantial risks. One risk is expectational. The policy rhetoric of the central leaders is increasingly liberal and even progressive, but the everyday practice of the Chinese bureaucracy is not. The millions of entrenched political elites are unlikely to change their behavior overnight. Rising expectations against the actual delivery of results on the ground may exacerbate social and political tensions. The case of the coordinated riots by demobilized soldiers, referred to previously, may be a harbinger of things to come.
The year 2008 may be a year of significance for China. As China celebrates its 13th anniversary of reforms, the country may enter into a period of some economic uncertainties. At the time of this writing, there are visible signs of economic risks, including a potential recession in the United States, an induced slowdown in the export demand by the United States, rising energy prices, and even the subprime crisis in the United States. The issue is not whether these developments would translate into an economic downturn for China (as for other countries); the issue is whether they would trigger financial instability in the form of a crisis. In this aspect, there are worrying signs.
Between 2005 and 2007, the index on the Shanghai Stock Market rose from 1,000 points to more than 6,000 points, but within six months, the market lost almost 50 percent of its value. This meteoric rise in stock market valuations between 2005 and 2007 was not matched by any signs of improving microeconomic fundamentals, which may be one reason for its subsequent decline. Although natural resource and other state monopolies are reporting record profits, the profitability picture of those firms that actually drive the growth and create employment is not sanguine. According to an analysis by the investment bank Macquarie, whereas the returns on the equity of the big-cap listed firms were rising, they were declining for the small-cap listed firms (Carvey 2006). Data from the PSS2006 show no substantial improvement in the profitability ratios of Chinese private-sector firms compared with the PSS2004. Signs of a massive bubble in the making are everywhere. Chinese media report on numerous instances in which the stock prices of a number of companies go up sharply – after they are punished for business fraud. This is not an “irrational exuberance,” as Alan Greenspan once described the US stock market and as he recently described the Chinese stock market in 2007.68 This is exuberant irrationality.
The lack of supporting economic fundamentals suggests that China is highly vulnerable to shocks. One trigger of asset market meltdowns could be the full dissipation of the psychological effects of the 2008 Summer Olympic Games. The 2008 Olympic Games may have two effects on market valuations. The widespread belief that the Chinese government will act to bolster the stock market in order to ensure the success of the Olympics may have contributed to its latest runs. The other effect is a perception that the market will peak around the time of the Olympics. If this belief is sufficiently widespread, the probability of a market crash around the time of the Olympics will by no means be trivial.
Until 2005, the ups and downs of the Chinese stock market were almost completely divorced from the real economy. Given the poor corporate governance practices of the listed firms, the low regulatory standards, and the corruption, this was a blessing in disguise because the separation reduced spillovers from the financial dysfunctions to the real economy. This time, however, things are different. For one thing, the first generation of Chinese stock market investors in the early 1990s was a select species. They were few in number and they had a high risk forbearance. The current generation of Chinese stock market investors is very heterogeneous. They range from sophisticated institutional investors to novel and uninformed individual investors such as school teachers, migrant workers, and even nannies. This latter group of investors lives on meager incomes and some have apparently invested their lifelong savings. As of 2007, Chinese stock market investors numbered in the neighborhood of 100 million. Some research has shown that the Chinese savings assets are extremely concentrated in the possession of a small number of depositors. The vast majority of Chinese depositors only have a low level of savings assets. The economic – and political – consequences of sharp and precipitous investment losses for such a large group of people can be devastating.
The bursting of the stock-market bubble poses a systemic risk in a way that the Chinese government has never faced. The Chinese state has defused many of the crisis situations in the past in large part because of its formidable ability to control information and prevent correlations of risks. In the 1990s, there were several episodes of bank runs. But, because the government imposed strict blockades of information, these bank runs were isolated and contained to the distressed regions. Such information control was vital because it allowed the authorities to mobilize savings assets from one region to recapitalize the financial institutions in the troubled region. The information controls thus reduced the likelihood of panic runs. By contrast, the movements of stock market prices are transparent and the very institution of the stock market operates on the principle of the correlated expectations, sentiments, and behavior of tens of millions of investors. In other words, the stock market, by its very design, automatically coordinates the beliefs and actions of a large group of individuals. The traditional technique of relying on isolation and segmentation is no longer operative. This is a completely new environment for the Chinese government.
There are other looming risks. At the time of this writing, China's inflation is reaching a new level. This may be due to some transitory factors such as the rising international oil prices, but a structural cause could be the massive urban boom. The urban boom – the frenzied building of skyscrapers and luxury government offices – does not boost the long-run potentials of the economy but it does exert huge short-term demand pressures for raw materials and intermediate products. It is arguable that this decade-long urban boom pulled China from its deflationary spiral of the late 1990s and put the country on an inflationary course. The prices of commodities and raw materials are rising at an accelerated pace. Chinese media report long lines outside gas stations as the country is now experiencing a shortage of fuel.
Another related effect of the policy-induced urban boom is the rising energy intensity of the Chinese economy. The urban boom exerted particularly strong effects on those sectors and products that are most energy-intensive, such as cement, steel, and aluminum. (Skyscrapers, highway construction, and passenger cars are all heavily urban products and they are most energy-intensive.) Now, with oil prices more than US$150 per barrel and with China importing half of its energy needs abroad, China will pay dearly for its policy mistakes of the 1990s.
Another source of cost increases is induced by policy. The currency appreciation has already threatened the margins of the small and medium enterprises in the export sector. In 2008, it is very likely that political pressures from the United States – in an election year possibly going into a recession – for China to revalue its currency to another level will increase substantially. There will be another policy shock in 2008 as well. On January 1, 2008, China put into effect a new labor law that requires businesses to offer permanent employment to workers with more than 10 years of employment. This new labor law will be very damaging to the economy. Labor market rigidity will reduce the incentives of entrepreneurs to create businesses and will drive away existing businesses to countries such as Vietnam and India. Aggregate employment may drop and thus further exacerbate the weaknesses of domestic demand, even though the intention of the law is to provide relief to China’s long suffering labor.
This new labor law is symptomatic of the leadership of Hu Jintao. The leadership has made many adjustments to the policy goals but not to the policy methods. The era of Jiang Zemin was associated with an industrial policy and big-push government initiatives. The government of Hu Jintao reassigned policy priorities, now giving greater weight to social objectives. But, it is implementing these objectives via the heavy interventionism of the government. There is little recognition that many of the social problems in China today are a result of a malfunctioning economic process, such as the blockage of small-scale entrepreneurship, and that the right recipe to correct these distortions is further liberalization. The 2008 labor law is one of many examples. Another example is the “construction of a new socialist countryside” program to improve farmers’ income through heavy government investments. This is a direct reversal of the urban-bias policy model of the 1990s but the method is still entirely administrative, similar to the antecedent urban-bias policy model.
The worst-case scenario for China is a perfect storm in which several economic and political risks converge at the most inopportune moment. The tenure of the current leaders will run through 2012. The next five years will be a litmus test for whether the country will emerge as another East Asian miracle or as a Latin American version of a vicious cycle of dashed expectations and perpetual turbulence. The Chinese leadership under Hu Jintao and Wen Jiabao has begun to turn around the rural situation. By any reasonable benchmarks, this is an improvement from the 1990s. The bad news is that almost all of their accomplishments so far have been the result of adjusting and revising the policy goals rather than the policy methods of the 1990s.
Many of the endemic problems in the Chinese economy today – massive pollution, corruption, inefficient capital deployment, land grabs, and so forth – cannot be tackled without meaningful institutional reforms, in particular, reforms of Chinese political governance. So far, the policy rhetoric is encouraging. The issue is whether the current leaders will truly follow their policy rhetoric to its logical conclusion – empowering people through political reforms. Only history will tell whether Hu Jintao and his colleagues are the right leaders for the right moment, but one thing we know for sure is that whatever they do will have monumental consequences for China and for the world.